

a. Sketch graphs of the probability density | ( x ) | 2 | (
Question:
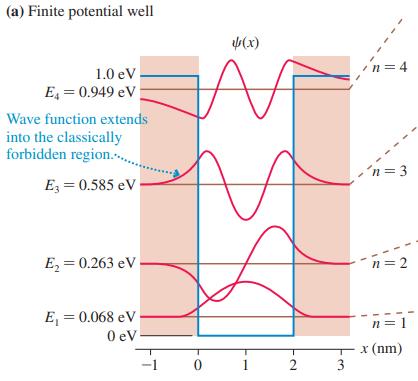
a. Sketch graphs of the probability density for the four states in the finite potential well of Figure 40.14a. Stack them vertically, similar to the Figure 40.14a graphs of .
b. What is the probability that a particle in the state of the finite potential well will be found at the center of the well? Explain.
c. Is your answer to part b consistent with what you know about standing waves? Explain.
Figure 40.14a:
Step by Step Answer:

This question has not been answered yet.
You can Ask your question!
Related Book For 

Physics for Scientists and Engineers A Strategic Approach with Modern Physics
ISBN: 978-0133942651
4th edition
Authors: Randall D. Knight
Question Posted:
