New Semester
Started
Get
50% OFF
Study Help!
--h --m --s
Claim Now
Question Answers
Textbooks
Find textbooks, questions and answers
Oops, something went wrong!
Change your search query and then try again
S
Books
FREE
Study Help
Expert Questions
Accounting
General Management
Mathematics
Finance
Organizational Behaviour
Law
Physics
Operating System
Management Leadership
Sociology
Programming
Marketing
Database
Computer Network
Economics
Textbooks Solutions
Accounting
Managerial Accounting
Management Leadership
Cost Accounting
Statistics
Business Law
Corporate Finance
Finance
Economics
Auditing
Tutors
Online Tutors
Find a Tutor
Hire a Tutor
Become a Tutor
AI Tutor
AI Study Planner
NEW
Sell Books
Search
Search
Sign In
Register
study help
business
applied statistics and multivariate
Applied Statistics For The Social And Health Sciences 1st Edition Rachel A. Gordon - Solutions
Write the four basic steps of the General Linear F-test.
How does the formula for the standard error of the slope in multiple regression differ from the formula for the standard error of the slope in bivariate regression?
How do we interpret the intercept and the slope of each predictor variable in a multiple regression model with two predictors, X1 and X2 , and the outcome of Y ?
Complex Sampling Designsa) SAS/Stata Tasks.i) Regress bmiR on age accounting for the complex sampling design features.ii) Regress age on bmiR accounting for the complex sampling design features.b) Write-Up Tasks.i) Use the results from this question, and the earlier question, to: (a)calculate the
and the slope in the output from this question (i.e., the new regression of age on bmiR) based on the Pearson correlation.ii) Briefl y, discuss how you would decide which variable ( bmiR or age) would be the dependent variable if you were writing a paper.
The Asymmetric Nature of Regressiona) SAS/Stata Tasks.i) Correlate bmiR with age .ii) Regress age on bmiR .iii) Calculate the unconditional standard deviation of age .b) Write-Up Tasks.i) Show how to calculate the slope in the output from Question
Changing the Units of Xa) SAS/Stata Tasks.i) Compute a new variable, age10 , defi ned as age divided by 10. ( Remember:In SAS this new variable creation must happen in the DATA step!).ii) Regress bmiR on this new variable.b) Write-Up Tasks.i) Based only on the output from Question 8.1, interpret
The Conditional Nature of Regressiona) SAS/Stata Tasks.
Interpretation and Hypothesis Testing in Bivariate Regressiona) SAS/Stata Tasks.i) Regress bmiR on age .ii) In SAS, use the /clb option to request the 95% confi dence intervals (recall that Stata calculates the confi dence intervals by default).b) Write-Up Tasks.i) Write the null and alternative
Consider a regression model with prediction equation Yˆ = 2.32 + 4.59 X, and Root Mean Square = 2.32. Based on these results, what are the estimated mean and standard deviation for the conditional distribution of Y when X = 0 and when X = 10?
Many social scientists would probably order the variables in our distance example as we have, predicting distance from the mother based on the adult’s earnings.Can you think of some reasons for this order? Can you think of reasons for reversing the order (how might distance affect the adult’s
Suppose a colleague sends you a data set that contains two variables, a measure of mental health, and a measure of marital satisfaction. How would you determine which variable should be the dependent variable and which the independent variable?
Consider a simple regression of Y on X based on a large sample size in whichˆβ1 = 5 and σˆ ˆβ 1 = 2.(a) Construct a 95 percent confi dence interval for the slope.(b) Write a one-sentence interpretation of the confi dence interval.
Does a positive slope coeffi cient from a simple regression model of Y on X mean that all observed Y values in the sample at X = 11 are larger than all observed Y values in the sample at X = 10, that the conditional mean predicted from the regression model at X = 11 is larger than the conditional
in the extreme case of no variation in the Xs?(That is, all X have the same value, and thus all Xi are equal to X¯ ).
What would happen to Equation
Write the formula for the standard error of the slope in bivariate regression and discuss what you might do as a researcher in planning a study in order to try to achieve a relatively small standard error.
when we regress Y on X . Now, suppose we create a rescaled X variable, which is equal to the original X variable divided by 5. What would be the slope coeffi cient from the regression of Y on the new variable?
Suppose that ˆβ1 =
Suppose you estimate an unstandardized slope coeffi cient of 0.5. If δY = 4 and δX= 2, what is the completely standardized slope?
Show how to calculate the unstandardized regression coeffi cient based on the Pearson correlation coeffi cient, standard deviation of X, and standard deviation of Y .
Suppose that you regress children’s reading achievement scores on the number of books in the household and obtain the following estimates: ˆβ0 = 70 and ˆβ1 = 0.60.(a) Interpret the intercept.(b) Interpret the slope.(c) Reinterpret the slope for an increase of 10 books.
Suppose that you estimate a bivariate regression of earnings on years of schooling and obtain the following estimates: ˆβ 0 = $20,000 and ˆβ1 = $5,000.(a) Interpret the intercept.(b) Interpret the slope.
How do the standardized slope, unstandardized slope, and Pearson correlation change if we reverse which variable we use as the outcome and which variable we use as the predictor in bivariate regression?
Defi ne the standardized slope using the standard deviation of X , standard deviation of Y, and the unstandardized slope.
What are some strategies you can use to determine if a signifi cant effect is substantively important (large or small)?
What are the three ways discussed in the chapter to “change units” in order to interpret a slope in a more substantively meaningful way (e.g., in units of 10,000s of dollars rather than units of dollars, for example).
Write the formula for a 95 percent confi dence interval about the slope. If you reject the null hypothesis in a two-sided hypothesis test, what do you expect to see in relation to the confi dence interval?
Write the formula for the test statistic of the slope in bivariate regression. What is the most common hypothesized value for the slope? Why? What are the null and alternative hypotheses about the slope tested in the default SAS and Stata output?
What are the three major factors that affect the size of the standard error of the slope in bivariate regression?
Will the conditional standard deviation be larger than, smaller than, or equal to, the standard deviation of the unconditional distribution of the outcome variable if the outcome and predictor variable are strongly associated? Why?
Write the formulas for the point estimate of the slope, conditional variance, and standard error of the slope, in bivariate regression.
Write a general bivariate population regression equation and bivariate sample regression equation, including the error terms. Indicate which is the systematic and which the random component of each. Discuss what the systematic and random components represent in the conditional distributions
Write the general statement that we use to interpret the slope from a bivariate regression model (i.e., do so in the “general” case of Y as the outcome variable, X as the predictor variable and β1 as the slope).
We can always mechanically interpret the intercept. What should we consider to determine if the intercept is substantively meaningful?
What does it mean, algebraically and geometrically, if the slope is equal to zero?
Weighted Statisticsa) SAS/Stata Tasks.i) Request weighted means for (1) age , (2) bmiR , and (3) exfreqwR within gender.ii) Request weighted proportions of race-ethnicity within gender.b) Write-Up Tasks.i) Create a table as you did in Question 7.4, but include only the weighted means and weighted
When creating the table, you can follow the conventions shown in the Literature Excerpt or use the style in your discipline. Either way, your goal will be that the table is “selfcontained” (interpretable on its own).
When creating the table, you can follow the conventions shown in either Literature Excerpt or use the style in your discipline. Either way, your goal will be that the table is “self-contained” (interpretable on its own).ii) Write a few sentence description of gender differences in the sample,
Cross-Question Write-upsb) Write-Up Tasks i) Create a table similar to the tables shown in Literature Excerpt 7.1 and 7.2 based on the results you obtained in Question 7.1 and
Two Interval Variablesa) SAS/Stata Tasks.i) Calculate the Pearson correlation between each pair of the following three variables: (1) age , (2) bmiR , and (3) exfreqwR .b) Write-Up Tasks.i) Based on the listed p-values, which of the pairs of variables are statistically uncorrelated (null) versus
Two Categorical Variablesa) SAS/Stata Tasks.i) Crosstabulate RACERPI2 and SEX and request row, column, and cell percentages.ii) Crosstabulate RACERPI2 and SEX and request the expected cell frequencies and the Pearson chi-square test.b) Write-Up Tasks.i) Interpret the row, column, and cell
One Categorical and One Interval Variablea) SAS/Stata Tasks.i) Conduct two-sample t-tests for gender differences in the mean of the following three variables: (1) age , (2) bmiR , and (3) exfreqwR assuming equal variances.ii) Test whether there is statistical evidence that the variances are equal
Calculate the column and row percentages for the observed and expected cell counts shown in Display B.7.5. (You can verify your calculations of the column and row percentages for the observed counts based on Display B.7.4). Discuss how the conditional and marginal column and row percentages differ
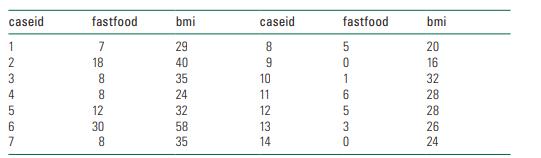
Imagine that you collected the following information about the number of fast food meals eaten each month and body mass index in a sample of 14 students drawn randomly from a local college.a. Calculate the mean monthly fast food consumption and mean body mass index in this sample.b. For each
Consider the following observed cell frequencies from a cross-tabulation of family income status and type of child care used for preschoolers, based on a sample randomly drawn from parents in a mid-western state.
Imagine that you draw a random sample from a population of employees in a Western city. The 300 employees in the sample who have less than a high school degree average $16,500 in annual earnings with a standard deviation of $5,100.The 500 employees in the sample who have a high school degree or
Discuss how weights are incorporated into the calculation of subgroup means, cross-tabulations, and the Pearson correlation.
Describe what patterns of association might result in Pearson correlations close to−1, 0, and 1, and why the numerator in the formula for the Pearson correlation would lead to large or small values in each case.
What are the minimum and maximum values of the Pearson correlation?
What are the null and alternative hypotheses for the Pearson correlation?
Describe how the observed frequencies are calculated and how they contribute to the size of the Pearson chi-square.
What are the null and alternative hypotheses for the Pearson chi-square test?
What are the null and alternative hypotheses for the one-way analysis of variance?
What are the major differences between the two ways to calculate the test statistic for the two-sample t -test discussed in the chapter?
What are the null and alternative hypotheses for the two-sample t -test discussed in this chapter?
How are bivariate statistics often used in social science publications?
Suppose that you measured the heights of a sample of 200 adults drawn randomly from all adult residents of a Southern city and found that the mean height was 71 inches with a standard deviation of 3.76.a. Where does a person with a height of 80 inches fall in this sample distribution, in standard
Imagine that you know that the standard deviation of math achievement tests in a population is 13.43.a. What would be the standard error for the sampling distribution of the mean math achievement test score if the sample size were 50? 250? 700? 1500?b. If the average math achievement test score in
Describe the basic shape of the chi-square distribution and discuss how it relates to the Z-distribution.
Describe the basic shape of the F-distribution and discuss how it relates to the t -distribution.
Describe the basic shape of the t -distribution and discuss how the t -distribution relates to the Z -distribution.
Describe the basic shape of the normal distribution.
What is a theoretical distribution?
What is the general structure of the formulas for test statistics based on the Z and t -distributions?
Defi ne the general concepts of p -values and calculated values.
Defi ne the general concepts of alpha levels and critical values.
What are null and alternative hypotheses?
When are Z -values rather than t -values used to draw inferences about the sample mean?
What is a standard error? How is the standard error affected by sample size?
What is the central limit theorem?
What is the empirical rule?
What is a standardized value?
Defi ne the sample distribution, population distribution, and sampling distribution and discuss how they are related to one another.
Weighted Valuesa) SAS/Stata Tasks.i) Calculate weighted proportions in each category for SEX, RACERPI2, and vigfreqwR .ii) Calculate the weighted mean and weighted standard deviation for bmiR , age , and exfreqwR .b) Write-Up Tasks.i) Create a new summary table and write a new description of the
When creating the table, you can follow the conventions shown in either Literature Excerpt or use the style in your discipline. Either way, your goal will be that the table is “self-contained” (interpretable on its own).ii) Use the results in Question 5.1, 5.2, and 5.3 to write a few sentence
Cross-Question Write-upsb) Write-Up Tasks i) Create a table similar to the tables shown in Literature Excerpt 5.1 and 5.2 based on the results you obtained in Question 5.1, 5.2, and
Interval Variablesa) SAS/Stata Tasks.i) Create a box plot and a histogram for bmiR , age , and exfreqwR.ii) Calculate the mean and standard deviation for bmiR , age , and exfreqwR .
Ordinal Variablesa) SAS/Stata Tasks.i) Calculate the percentage distribution for vigfreqwR .ii) Calculate the quartiles for vigfreqwR .b) Write-Up Tasks.i) What is the mode of vigfreqwR ?ii) What is the median of vigfreqwR ?
Nominal Variablesa) SAS/Stata Tasks.i) Calculate percentage distributions for the SEX and RACERPI2 variables.b) Write-Up Tasks.i) What is the mode for SEX and for RACERPI2?
Discuss where you would expect the value of the mean to fall relative to the median and the mode in a symmetric, left skewed and right skewed distribution.
If the 25th, 50th and 75th percentiles of household income in your data are$15,000, $32,000 and $48,000 respectively, then what is the interquartile range of income in your data?
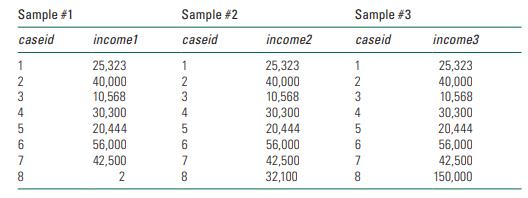
Imagine you have three separate samples of eight respondents who report the following household incomes.a. What is the mean of each variable ( income1 , income2 , and income3)?b. What is the standard deviation of each variable ( income1, income2, and income3)?c. What is the median of each variable
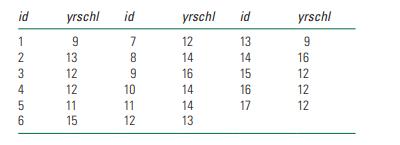
Imagine you have a sample of 17 respondents who report that they have completed the following years of schooling.a. What is the frequency distribution of the yrschl variable?b. What is the percentage distribution of the yrschl variable?c. What is the mode of the yrschl variable?d. What is the
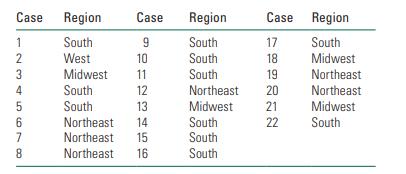
Suppose that you have gathered a sample of 22 people who live in the following regions of the U.S.a. What is the frequency distribution of the Region variable?b. What is the percentage distribution of the Region variable?c. What is the mode of the Region variable? Case Region Case Region Case
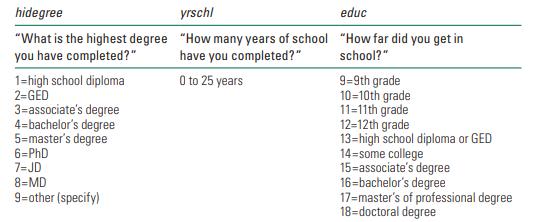
Consider the three education variables whose survey questions and response categories are listed below. Discuss which of the types of variables listed in Table 5.1 are consistent with each variable (allowing each variable to have more than one type, where relevant). What do you see as some
How do the calculations of the weighted mean, proportion, and standard deviation differ from the calculation of the unweighted mean, proportion, and standard deviation?
Why is weighting needed for complex sampling designs?
What fi ve values are shown in a standard box plot? How are outliers indicated?
Defi ne the two measures of variation discussed in the chapter.
How do the mean and median relate to one another in symmetric, right skewed and left skewed distributions?
Defi ne the mean, median and mode.
What are percentiles?
What are frequency, relative frequency, and percentage distributions, respectively?
Which of the descriptive statistics introduced in this chapter are strictly appropriate for each type of variable?
What are some basic types of variables commonly used in the social sciences?Provide examples of each (try to think of some examples that might be considered to fall in more than one type).
Write and run the CreateData example shown in Display B.4.7 in SAS and/or Stata.Use the techniques described in Section 4.3.2 to verify that the variables are created correctly.
Request the frequency distributions for E1302 and E1305 from SAS and/or Stata and compare them to the results in BADGIR (shown in Display C.3.7 and Display C.3.8) to confi rm that these variables were correctly downloaded.
Replicate the ReadAFewVariables example in SAS and/or Stata from Section 4.1.1;that is, launch the software, open the editor, and type the code to match the batch program shown in Display B.4.4. Be careful to check for typos (which can lead to error messages). Run the batch program and view the
Follow the steps in Appendix D to create the SAS and/or Stata raw data fi les for the NSFH data set.
Showing 100 - 200
of 2391
1
2
3
4
5
6
7
8
9
10
11
12
13
14
15
Last
Step by Step Answers