New Semester Started
Get
50% OFF
Study Help!
--h --m --s
Claim Now
Question Answers
Textbooks
Find textbooks, questions and answers
Oops, something went wrong!
Change your search query and then try again
S
Books
FREE
Study Help
Expert Questions
Accounting
General Management
Mathematics
Finance
Organizational Behaviour
Law
Physics
Operating System
Management Leadership
Sociology
Programming
Marketing
Database
Computer Network
Economics
Textbooks Solutions
Accounting
Managerial Accounting
Management Leadership
Cost Accounting
Statistics
Business Law
Corporate Finance
Finance
Economics
Auditing
Tutors
Online Tutors
Find a Tutor
Hire a Tutor
Become a Tutor
AI Tutor
AI Study Planner
NEW
Sell Books
Search
Search
Sign In
Register
study help
business
bayesian biostatistics
Principles Of Biostatistics 3rd Edition Marcello Pagano, Kimberlee Gauvreau, Heather Mattie - Solutions
Does a hypothesis test ever prove the null hypothesis? Explain.
What is the purpose of a test of hypothesis?
The Bayley Scales of Infant Development yield scores on two indices-the Psychomotor Development Index (PDI) and the Mental Development Index (MEX)- which can be used to assess a child's level of functioning in each of these areas ar approximately one year of age. Among normal healthy infants, both
The data ser lowbwt contains information recorded for a sample of 100 low birth weight infants born in two eaching hospitals in Boston, Massachusetts [81]. Measurements of systolic blood pressure are saved under the variable name sbp, while indicators of sex- where 1 represents a male and O a
Serum zinc levels for 462 males between the ages of 15 and 17 are saved under the variable name zinc in the data set serum zinc [75]. The units of measurement *x serum zinc level are micrograms per deciliter. (a) Find a two-sided 95% confidence interval for , the true mean ser un zinc level for the
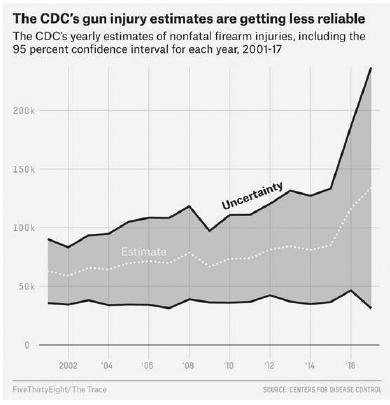
Figure 9.4 displays estimates of the annual number of nonfatal firearm injuries in the United States from 2001 through 2017, along with 95% confidence intervals [188]. (a) What does this figure tell you about changes in the number of nonfatal firearminjuries over time? (b) What does this figure ell
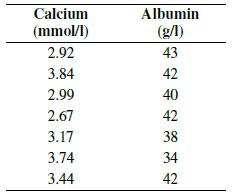
When eight persons in Massachusetts experienced an unexplained episode of vitamin D intoxication that required hospitalization, it was suggested that these unusual occurrences might be the result of excessive supplementation of dairy milk [71]. Blood levels of calcium and albumin for each
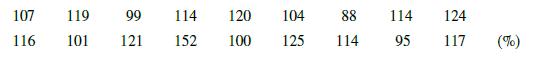
Percentages of Ideal body weight were determined for 18 randomly selected Insulin- dependent diabetics and recorded below [187]. A percentage of 120 means that an Individual weighs 20% more than his or her ideal body weight; a percentage of 95 means that the Individual weighs 5% less than the
For the population of Infants undergoing fetal surgery for congenital anomalies, the distribution of gestational ages at birth is approximately normal with unknown mean and standard deviation or. A random sample of 14 such infants has mean gestational age * = 29.6 weeks and standard deviations =
Before beginning a study investigating the ability of the drug heparin to prevent bron- choconstriction, baseline values of pulmonary function were measured for a sample of 12 Individuals with a history of exercise-Induced asthma [185]. The mean value of forced vital capacity (PVC) for the sample
Consider the distribution with 21 degrees of freedom. (a) What proportion of the area under the curve Iles to the left of r = -2.518? (b) What proportion of the area lies to the right of 7 = 1.323? (c) What proportion of the area lies between = -1.721 and 1 = 2.831? (d) What is the 2 .5th
Consider the distribution with 5 degrees of freedom. (a) What proportion of the area under the curve Iles to the right of t = 2.015? (b) What proportion of the area lies to the left of r = -3.365? (c) What proportion of the area lies between = -4.032 and 7 = 4.032? (d) What is the 97.5th percentile
The distributions of systolic and diastolic blood pressures for female diabetics between the ages of 30 and 34 have unknown means. However, their standard deviations are s = 11.8 mm Hg and ord=9.1 mm Hg, respectively [184]. (a) A random sample of 10 women is selected from this population. The mean
Describe the similarities and differences between the distribution and the standard normal distribution. If you are constructing a confidence interval, when would you use one rather than the other?
What are the factors that affect the length of a confidence interval for a mean? Explain briefly.
Describe the 95% confidence Interval for a population mean p. How is the interval Interpreted?
Explain the difference between point and interval estimation.
At the end of Section 8.3, It was noted that for samples of serum cholesterol levels of size 25 drawn from a population with mean = 211 mg/100 ml and standard deviation o = 46 mg/100 ml, the probability that a sample mean I lies within the Interval (193.0, 229.0) is 0.95. Furthermore, the
For the population of adult males in the United States, the distribution of weights is approximately normal with mean = 172.2 pounds and standard deviation = 29.8 pounds [165].(a) Describe the distribution of means of samples of size 25 which are drawn from this population. (b) What is the upper
In the Netherlands, healthy males between the ages of 65 and 79 have a distribution of serum uric acid levels that is approximately normal with mean = 341 mol/l and standard deviation = 79 mol/l [178]. (a) What proportion of the males have a serum uric acid level between 300 and 400 mol/l? (b) What
For the population of females between the ages of 3 and 74 who participated in the National Health Interview Survey, the distribution of hemoglobin levels has mean = 13 .3 g/100 ml and standard deviation or1.12 g/100 ml [75]. (a) If repeated samples of size 15 are selected from this population,
In Norway, the distribution of birth weights for infants whose gestational age is 40 weeks is approximately normal with mean = 3500 grams and standard deviation = 430 grams [177]. (a) Given a newborn whose gestational age is 40 weeks, what is the probability that his or her birth weight is less
In Denver, Colorado, the distribution of daily measures of ambient nitric acid, a corrosive liquid, is skewed to the right. It has mean =1.81 g/m and standard deviation =2.25 g/m [176]. Describe the distribution of means of samples of size 40 selected from this population.
Consider a random variable Z which has a standard normal distribution with mean = 0 and standard deviation = 1.(a) What can you say about the distribution of means of samples of size 10 which are drawn from this population? List three properties. (b) What proportion of the means of samples of size
Among adults in the United States, the distribution of the protein albumin in cerebrospinal fluid is roughly symmetric with mean = 29.5 mg/100 ml and standard deviation 9.25 mg/100 ml [175]. Suppose that you select repeated samples of size 20 from the population of albumin levels and calculate the
What is consistency?
What happens to the amount of sampling variability among a set of sample means 1,2,3,... as the size of the samples Increases?
What is the standard error of a sample mean? How does the standard error compare to the standard deviation of the population?
Why is it necessary to understand the properties of a theoretical distribution of means of samples of size n drawn from a population, when in practice you will only select a single such sample?
When making inference, why is it important that a sample drawn from a population be a random sample?
In the Framingham Heart Study, serum cholesterol levels were measured for a large number of healthy males. The population was then followed for 16 years. At the end of this time, the males were divided into two groups: those who had developed coronary heart disease and those who had not. The
The Wechsler Adult Intelligence Scale, commonly called an IQ score, is designed to have a normal distribution with mean = 100 and standard deviation = 15 in the general population. (a) What is the probability that an adult selected from the general population has an IQ score above 100? (b) What is
The distribution of weights for the population of males in the United States is ap- proximately normal with mean = 172.2 pounds and standard deviation = 29.8 pounds [165]. (a) What is the z-score associated with a weight of 130 pounds? (b) What is the probability that a randomly selected male
Among females in the United States between 18 and 74 years of age, diastolic blood pressure is normally distributed with mean = 77 mm Hg and standard deviation = 11.6 mm Hg [161].(a) What is the probability that a randomly selected female has a diastolic blood pressure less than 60 mm Hg? (b) What
Consider the standard normal distribution with mean = 0 and standard deviation = 1.(a) What is the probability that an outcome z is greater than 2.60? (b) What is the probability that z is less than 1.35? (c) What is the probability that z is between -1.70 and 3.10? (d) What value of z cuts off the
Let X be a random variable that represents the number of infants in a group of 2000 who die before reaching their first birthdays. In the United States, the probability that a child dies during his or her first year of life is 0.0059 [171]. (a) What is the mean number of infants who would die in a
In a particular county, the average number of suicides reported each month is 2.75 [170]. Assume that the number of suicides follows a Poisson distribution. (a) What is the probability that no suicides will be reported during a given month? (b) What is the probability that at most four suicides
The number of cases of tetanus reported in the United States during a single month has a Poisson distribution with parameter = 4.5 [164]. (a) What is the probability that exactly one case of tetanus will be reported during a given month? (b) What is the probability that at most two cases of tetanus
According to the Youth Risk Behavior Surveillance System, 20.7% of all American high school students watch television for three or more hours on a typical school day [169]. (a) If you select repeated samples of size 20 from the population of high school students, what would be the mean number of
According to the National Health Survey, 9.8% of the population of 18- to 24-year-olds in the United States are left-handed [165]. (a) Suppose that you select ten individuals from this population. In how many ways can the ten persons be ordered? (b) Without regard to order, in how many ways can you
Consider a group of seven individuals selected from the population of adults age 65 years and older residing in the United States. The number of persons in this sample who suffer from diabetes is a binomial random variable with parameters n = 7 and p 0.252 [168]. (a) If you wish to make a list of
Suppose that you are interested in monitoring air pollution in Los Angeles, California, over a one-week period. Let X be a random variable that represents the number of days in a week on which the concentration of carbon monoxide surpasses a specified level. Do you believe that X has a binomial
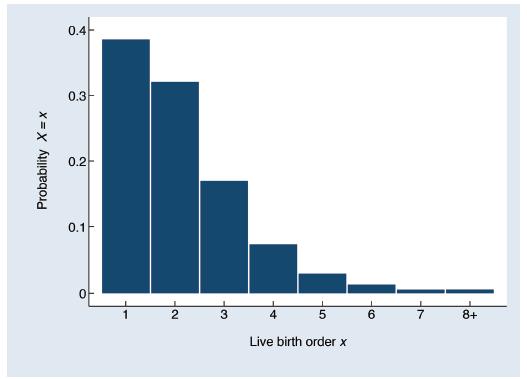
Figure 7.18 displays the probability distribution of the random variable X representing the birth order of a child born in the United States [167]. Using the graph, estimate the following: (a) The probability that a child is its mother's fourth child (b) The probability that a child is its mother's
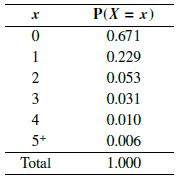
Let X be a discrete random variable that represents the number of diagnostic services a child receives during an office visit to a pediatric specialist; these services include procedures such as blood tests and urinalysis. The probability distribution for X appears below [166].(a) Construct a graph
Explain the importance of the standard normal distribution.
What are the properties of the normal distribution?
What are three properties associated with the Poisson distribution?
What are three properties associated with the binomial distribution?
What is a probability distribution? How can a probability distribution be represented?
A study was conducted investigating the use of fasting capillary glycemia (FCG) - the level of glucose in the blood for individuals who have not eaten in a specified number of hours - as a screening test for diabetes [157]. FCG cutoff points ranging from 3.9 to 8.9 mmol/liter were examined; the
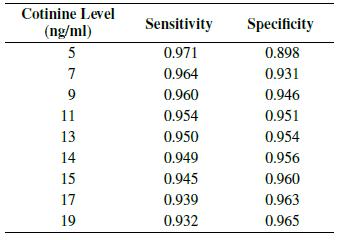
The table below displays data taken from a study comparing self-reported smoking status with measured serum cotinine level [66]. As part of the study, cotinine level was used as a diagnostic tool for predicting smoking status; the self-reported status was considered to be true. For a number of
When screening for prostate cancer, many physicians use a prostate-specific antigen (PSA) level 4.1 ng/ml as a positive test result. Using this PSA cutoff, 82% of males under the age of 60 years who have prostate cancer will test negative, and 2% of those who do not have cancer will test positive
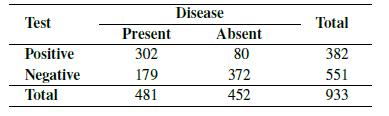
The following data are taken from a study investigating the use of a technique called radionuclide ventriculography as a diagnostic test for detecting coronary artery dis- ease [155].(a) What is the sensitivity of radionuclide ventriculography in this study? What is its specificity? (b) For a
The National Institute for Occupational Safety and Health has developed a case definition of carpal tunnel syndrome - an affliction of the wrist - that incorporates three criteria: symptoms of nerve involvement, a history of occupational risk factors, and the presence of physical exam findings
One study has reported that the sensitivity of the mammogram as a screening test for detecting breast cancer is 0.869 while its specificity is 0.889 [153]. (a) What is the probability of a false negative test result? (b) What is the probability of a false positive test result? (c) In a population
What is an advantage of reporting the positive likelihood ratio of a screening test rather than the positive predictive value?
What would happen to the specificity of a screening or diagnostic test if you were to try to increase its sensitivity?
What is the value of Bayes' theorem? How is it applied in diagnostic testing?
In May 2020, the United States contained 4.3% of the world's population [140], but had 33.0% of confirmed COVID-19 cases [141]. What was the relative risk of developing COVID-19 for individuals in the United States versus the rest of the world?
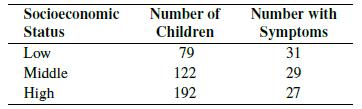
A community-based study of respiratory illness during the first year of life was conducted in North Carolina. As part of this study, a group of children were classified according to family socioeconomic status. The numbers of children in each group who experienced persistent respiratory symptoms
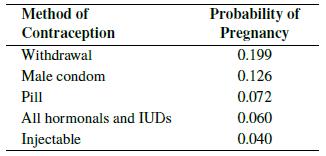
For several different methods of contraception, the probabilities that a female experiences an unplanned pregnancy during the first year of use are provided below [138].(a) What is the relative risk of pregnancy during the first year of use for females who use male condoms as their method of
In Section 5.4, we describe a cohort study that examined the risk factors for breast cancer among females participating in the first National Health and Nutrition Examination Survey In the 1980s [128]. A female was considered to be "exposed" if she first gave birth at age 25 years or older, and
Refer to Table 4.2, the 2016 life table for the United States [113]. (a) What is the probability that a newborn infant will live to see their 5th birthday? (b) What is the probability that a newborn infant will live to be 20 years of age? (c) What is the probability that an individual who is 60
In the United States in 2018, 27.5 million people, or 8.5% of the population, did not have health Insurance coverage of any kind [137]. (a) If you were to randomly select two individuals from the population, what is the probability that both are uninsured? (b) What is the probability that both
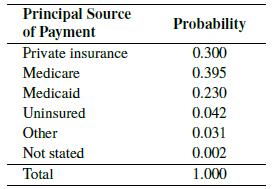
The probabilities associated with the expected primary payer for hospital discharges in the United States in the year 2016 are listed below [136].(a) What is the probability that the primary payer for a given hospital discharge is the patient's private insurance? (b) What is the probability that
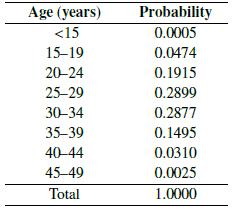
Consider the natality statistics for the United States population in 2018 provided be- low [125]. The probabilities that a randomly selected woman who gives birth is in each of the age groups are listed.(a) What is the probability that a woman who gives birth is 24 years of age or younger? (b) What
In Review Exercise 6, suppose we do not know the probability that a newborn weighs less than 2500 grams when the payment source is Medicaid. However, we do know the probability that a newborn weighs less than 2500 grams given their gestational age is less than 37 weeks is 0.448, and the probability
For live births in the United States in 2017 where the payment source was Medicaid, the probability that a newborn's gestational age is less than 37 weeks is 0.131 and the probability that his or her birth weight is less than 2500 grams is 0.094 [136]. Furthermore, the probability that these two
Let A represent the event that a particular individual is exposed to high levels of carbon monoxide and B the event that they are exposed to high levels of nitrogen dioxide. (a) What is the event AB? (b) What is the event A UB? (c) What is the complement of A? (d) Are the events A and B mutually
How can the probabilities of an outcome in two different populations - exposed and unexposed groups - be compared?
Explain the difference between mutually exclusive and independent events.
What are the three basic operations that can be performed on events?
What is the frequentist definition of probability?
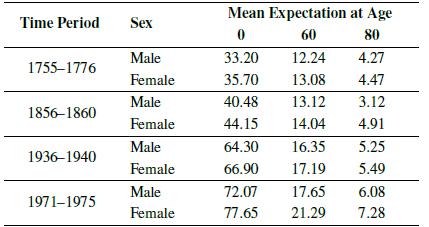
The table below contains the mean expectations of life in years at three different ages for males and females in Sweden over a period of two centuries [124].This table has been used as evidence in the argument that the human lifespan is get- ting longer. Discuss the table, giving your
In young adult life, it has been noted that males have a higher rate of accidental and violent death than do females. (a) Explain the effect that this would have on a male life table relative to the corresponding female life table with respect to the age-specific death rates for the young adult
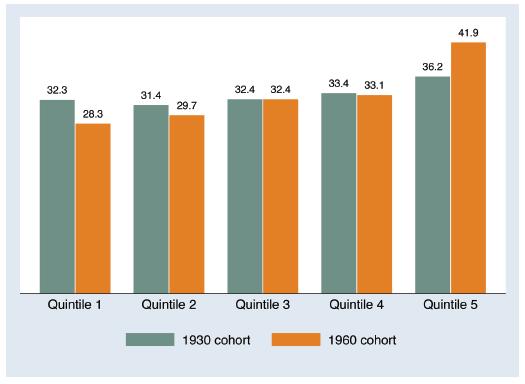
Interpret the bar chart in Figure 4.13 [123].
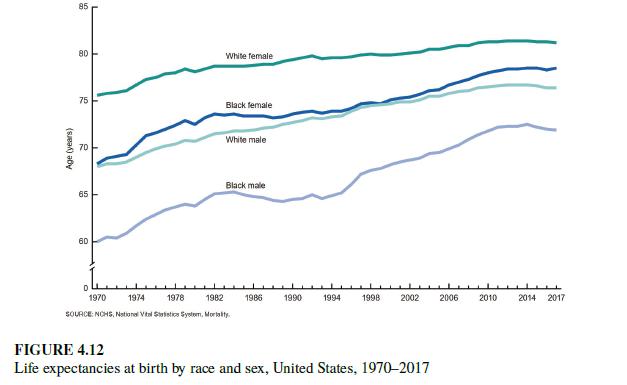
Interpret the line graphs in Figure 4.12 [122]. Discuss changes over time, as well as differences by race and sex.
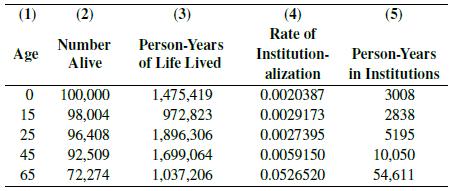
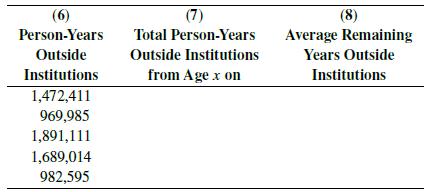
A study exploring the lives of Canadian males in various states of health presents an interesting application of the life table [121]. When constructing their table, the authors divided the person-years lived during a given age interval (Lx) into person-years lived inside of institutions and
You plan to sell life insurance, and wish to determine the price you should charge for a policy. You do not want to lose money. Suppose you lived in the 17th century and decided to base your calculations on Halley's life table shown in Figure 4.3. The rule is that if you sell a 5-year policy with
Refer to Table 4.2, the United States life table for 2016 . (a) What proportion of individuals will live to their 21st birthday? (b) What proportion of 21-year-olds will live to their 40th birthday? (c) What proportion of 40-year-olds will live to their 70th birthday? (d) What proportion of
Why have the biggest reductions in mortality over the past hundred years been made in the relatively younger age groups rather than the older ones?
Explain the concept of the stationary population within an interval of the life table.
What is a hazard function?
What is the difference between cross-sectional and longitudinal data?
Describe two practical applications of the life table.
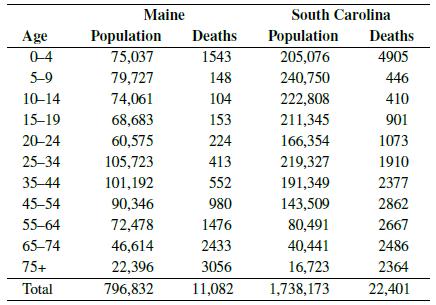
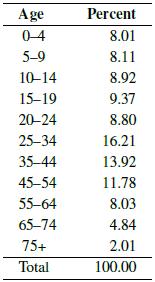
In 1940, a statistician at the Bureau of the Census was interested in comparing the death rate in Maine to the death rate in South Carolina. The table below contains the relevant data [109].(a) Compute the crude mortality rates in Maine and South Carolina. (b) For each state, calculate the
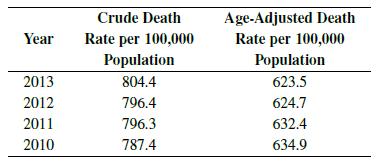
Between the years 2010 and 2013, the crude death rate for females in the United States increased steadily. At the same time, the age-adjusted death rate decreased. The relevant data are shown below [82]. Explain how the age-adjusted rate could decrease while the crude rate is rising. Crude Death
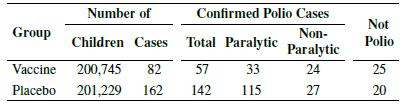
In 1954, a study tested the effectiveness of the poliomyelitis vaccine developed by Dr. Jonas Salk [108]. Poliomyelitis is a communicable illness caused by the poliovirus; it ranges in severity from a mild infection to fatal paralytic disease. First, second, and third graders in the United States
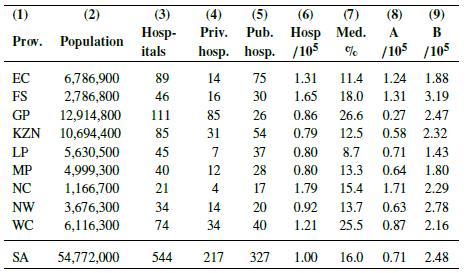
Below is a table containing information about the distribution of hospitals across the nine provinces of South Africa [107]. Column 1 lists the nine provinces; the last entry represents the country as a whole. Column 2 contains the population size. The next three columns display the number of
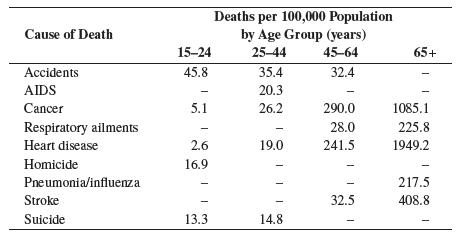
In a report investigating factors which affect the human life span, the leading causes of death at various ages in a person's lifetime were examined. For each of the four age groups 15 to 24 years, 25 to 44 years, 45 to 64 years, and 65 years and above, the numbers of deaths in the United States
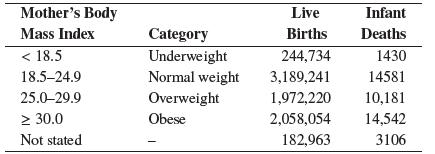
In the table below, the numbers of live births and infant deaths in the United States in 2017 are categorized by mother's body mass index [105].(a) Compute the infant mortality rate for each category of mother's body mass index. (b) What can you say about the relationship between infant mortality
The data below were reported for Massachusetts in 2017 [103, 104].Compute the following rates: (a) Crude birth rate (b) Crude death rate (c) Infant mortality rate
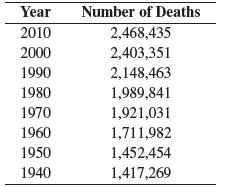
The total numbers of deaths in the United States at 10-year intervals are presented below [82].The statement is made that since the number of deaths has been increasing over the years from 1940 through 2010, the population as a whole must be growing less healthy. Do you agree with this statement?
How does the choice of a standard population distribution affect the results of the stan- dardization process?
How does the direct method of standardization differ from the indirect method? When would you use one method rather than the other?
What is an adjusted rate? When would you want to use adjusted rates?
What is a confounder?
What is the difference between a rate and a proportion?
What are demographic data and vital statistics? How can they be used to describe the health status of a population?
The data set lowbwt contains information recorded for a sample of 100 very low birth weight infants — those weighing less than 1500 grams — born in two teaching hospitals in Boston, Massachusetts [81]. Measurements of systolic blood pressure are saved under the variable name sbp. The
Showing 600 - 700
of 884
1
2
3
4
5
6
7
8
9
Step by Step Answers