New Semester
Started
Get
50% OFF
Study Help!
--h --m --s
Claim Now
Question Answers
Textbooks
Find textbooks, questions and answers
Oops, something went wrong!
Change your search query and then try again
S
Books
FREE
Study Help
Expert Questions
Accounting
General Management
Mathematics
Finance
Organizational Behaviour
Law
Physics
Operating System
Management Leadership
Sociology
Programming
Marketing
Database
Computer Network
Economics
Textbooks Solutions
Accounting
Managerial Accounting
Management Leadership
Cost Accounting
Statistics
Business Law
Corporate Finance
Finance
Economics
Auditing
Tutors
Online Tutors
Find a Tutor
Hire a Tutor
Become a Tutor
AI Tutor
AI Study Planner
NEW
Sell Books
Search
Search
Sign In
Register
study help
business
business statistics communicating
Business Statistics Communicating With Numbers 3rd Edition Sanjiv Jaggia - Solutions
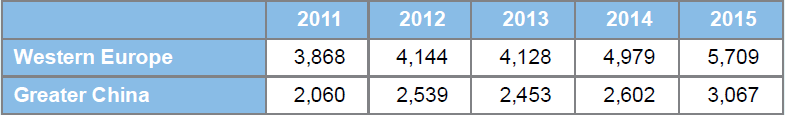
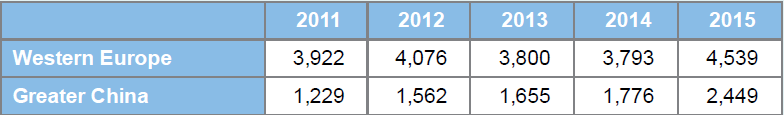
In a report, use the sample information to1. Summarize the growth rates in Western Europe and Greater China for Nike.2. Summarize the growth rates in Western Europe and Greater China for Adidas.3. Discuss the similarities and the differences of the growth rates in the two companies.Nike’s Online
Calculate the average growth rate from the following growth rates. 2.5% 3.6% 1.8% 2.2% 5.2%
Given the following investment returns, calculate the geometric mean return. -3% 2% -5% 2.7% 3.1%
Given the following investment returns, calculate the geometric mean return. 4% 8% -5% 6%
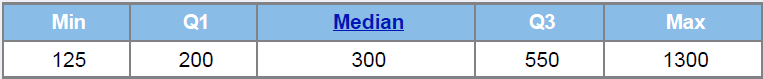
Consider the following five-point summary that was obtained from a data set with 500 observations.a. Interpret Q1 and Q3.b. Calculate the interquartile range. Determine whether any outliers exist.c. Is the distribution symmetric? If not, comment on its skewness. Min Q1 Median Q3 Max 125 200 300 550
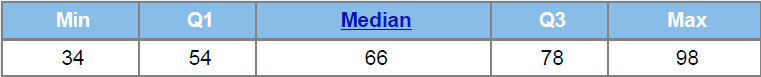
Consider the following five-point summary that was obtained from a data set with 200 observations.a. Interpret Q1 and Q3.b. Calculate the interquartile range. Determine whether any outliers exist.c. Is the distribution symmetric? If not, comment on its skewness. Min Median Q3 Max Q1 34 54 66 78 98
The following table shows a portion of the sale price (in $1,000s) for 36 homes sold in Mission Viejo, CA, during June 2010.Number . . . . . . . . . . Price1 . . . . . . . . . .. . . . . . . .4302. . . . . . . . . .. . . . . . . . 520⋮. . . . . . . . . .. . . . . . . . . . ⋮36 . . .
An investor bought common stock of Apple Inc. on three occasions at the following prices.Date Price . . . . . . . . . . . . . . . Per ShareJanuary 2016 . . . . . . . . . . . . . . .94.81July 2016. . . . . . . . . . . . . . .. . . .102.67December 2016. . . . . . . . . . . . 115.32a. What is the
You score 90 on the midterm, 60 on the final, and 80 on the class project. What is your average score if the midterm is worth 30%, the final is worth 50%, and the class project is worth 20%?
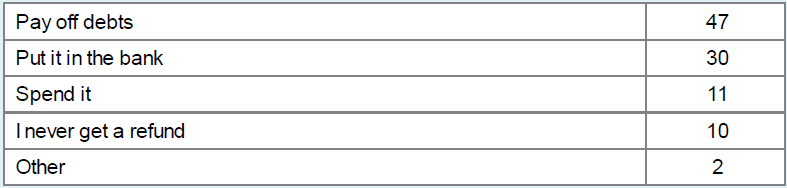
A survey conducted by CBS News asked 1,026 respondents: “What would you do with an unexpected tax refund?” The responses (in %) are summarized in the following table.a. Graph the bar chart.b. How many people will spend the tax refund? Pay off debts Put it in the bank Spend it 47 30 11 Inever
Construct a scatterplot with the following data. Describe the relationship between x and y. 2 6 8 х 22 20 18 10 4 3 У
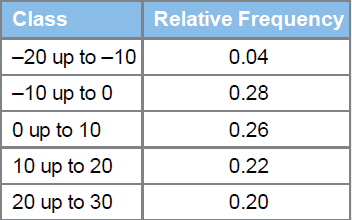
Consider the following relative frequency distribution:a. Suppose this relative frequency distribution is based on a sample of 50 observations. Construct the frequency distribution. How many of the observations are at least −10 but less than 0?b. Construct the cumulative frequency distribution.
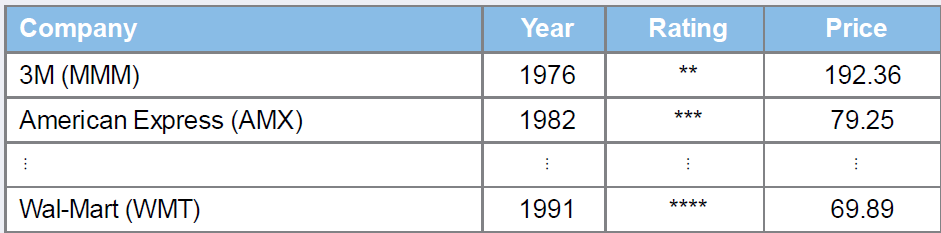
The accompanying table shows a portion of the 30 companies that comprise the Dow Jones Industrial Average (DJIA). The second column shows the year that the company joined the DJIA (Year). The third column shows each company’s Morningstar rating (Rating). (Five stars is the best rating that a
Conduct an online search for a weekly car rental in Seattle, Washington, and Portland, Oregon, for different car types and rental car companies for the year 2017. Are the data structured or unstructured? Are the data cross-sectional or time series?
Ask your peers about their online social media usage. In particular collect information on (a) whether they use Facebook, Instagram, and Snapchat, (b) how often they use each social media service, and (c) their overall satisfaction with each of these services using a 5-point numerical scale where 1
Conduct an online search to compare price and fuel economy of small hybrid vehicles such as Toyota Prius, Ford Fusion, and Chevrolet Volt. Would the resulting data be structured or unstructured? Explain.
Go to The New York Times website at www.nytimes.com/ and review the front page. Would you consider the data on the page to be structured or unstructured? Explain.
The Federal Reserve Bank of St. Louis is a good source for downloading economic data.Go to research.stlouisfed.org/fred2/ to extract quarterly data on gross private saving (GPSAVE) from 2012 to 2015 (16 observations). Create a table that uses this information. Plot the data over time and
Go to www.finance.yahoo.com/ to get a current stock quote for General Electric, Co. (ticker symbol = GE). Then, click on historical prices to record the monthly adjusted close price of General Electric stock in 2016. Create a table that uses this information. What type of data do these numbers
Business graduates in the United States with a marketing concentration earn high salaries. According to the Bureau of Labor Statistics, the average annual salary for marketing managers was $140,660 in 2015.a. What is the relevant population?b. Do you think the average salary of $140,660 was
Showing 6000 - 6100
of 6020
First
47
48
49
50
51
52
53
54
55
56
57
58
59
60
61
Step by Step Answers