

Question: As your instructor directs, a. Identify visuals that you might use to help analyze each of the following data sets. b. Identify and create a
As your instructor directs,
a. Identify visuals that you might use to help analyze each of the following data sets.
b. Identify and create a visual or data display for one or more of the stories in each set.
c. Identify additional information that would be needed for other stories related to these data sets.
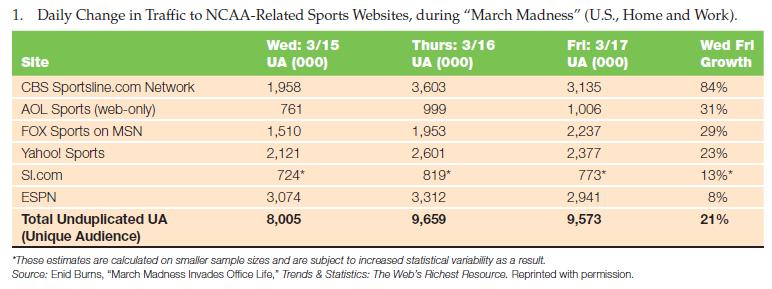
1. Daily Change in Traffic to NCAA-Related Sports Websites, during "March Madness" (U.S., Home and Work). Wed: 3/15 Site UA (000) Thurs: 3/16 UA (000) Fri: 3/17 UA (000) Wed Fri Growth CBS Sportsline.com Network 1,958 3,603 3,135 84% AOL Sports (web-only) 761 999 1,006 31% FOX Sports on MSN 1,510 1,953 2,237 29% Yahoo! Sports 2,121 2,601 2,377 23% Sl.com 724* 819* 773* 13%* ESPN 3,074 3,312 2,941 8% Total Unduplicated UA 8,005 9,659 9,573 21% (Unique Audience) *These estimates are calculated on smaller sample sizes and are subject to increased statistical variability as a result. Source: Enid Burns, "March Madness Invades Office Life," Trends & Statistics: The Web's Richest Resource. Reprinted with permission.
Step by Step Solution
There are 3 Steps involved in it

Get step-by-step solutions from verified subject matter experts