New Semester
Started
Get
50% OFF
Study Help!
--h --m --s
Claim Now
Question Answers
Textbooks
Find textbooks, questions and answers
Oops, something went wrong!
Change your search query and then try again
S
Books
FREE
Study Help
Expert Questions
Accounting
General Management
Mathematics
Finance
Organizational Behaviour
Law
Physics
Operating System
Management Leadership
Sociology
Programming
Marketing
Database
Computer Network
Economics
Textbooks Solutions
Accounting
Managerial Accounting
Management Leadership
Cost Accounting
Statistics
Business Law
Corporate Finance
Finance
Economics
Auditing
Tutors
Online Tutors
Find a Tutor
Hire a Tutor
Become a Tutor
AI Tutor
AI Study Planner
NEW
Sell Books
Search
Search
Sign In
Register
study help
business
discovering knowledge in data
Discovering Knowledge In Data An Introduction To Data Mining 2nd Edition Daniel T. Larose, Chantal D. Larose - Solutions
Explore whether there are missing values for any of the variables.
Compare the area code and state fields. Discuss any apparent abnormalities.
Use a graph to visually determine whether there are any outliers among the number of calls to customer service.
Identify the range of customer service calls that should be considered outliers, using:a. The Z-score method, andb. The IQR method.
Work with skewness as follows.a. Calculate the skewness of day minutes.b. Then calculate the skewness of the Z-score standardized day minutes. Comment.c. Based on the skewness value, would you consider day minutes to be skewed or nearly perfectly symmetric?
Construct a normal probability plot of day minutes. Comment on the normality of the data.
Work with international minutes as follows.a. Construct a normal probability plot of international minutes.b. What is stopping this variable from being normally distributed.c. Construct a flag variable to deal with the situation in (b).d. Construct a normal probability plot of the derived variable
Transform the night minutes attribute using Z-score standardization. Using a graph, describe the range of the standardized values.
Explain the difference between EDA and hypothesis testing, and why analysts may prefer EDA when doing data mining.
Why do we need to perform exploratory data analysis? Why should not we simply proceed directly to the modeling phase and start applying our high powered data mining software?
Why do we use contingency tables, instead of just presenting the graphical results?
How can we find the marginal distribution of each variable in a contingency table?
What is the difference between taking row percentages and taking column percentages in a contingency table?
What is the graphical counterpart of a contingency table?
Describe what it would mean for interaction to take place between two categorical variables, using an example.
What type of histogram is useful for examining the relationship between a numerical predictor and the target?
Explain one benefit and one drawback of using a normalized histogram. Should we ever present a normalized histogram without showing its nonnormalized counterpart?
Explain whether we should omit a predictor from the modeling stage if it does not show any relationship with the target variable in the EDA stage, and why.
Describe how scatter plots can uncover patterns in two dimensions that would be invisible from one-dimensional EDA.
Make up a fictional data set (attributes with no records is fine) with a pair of anomalous attributes. Describe how EDA would help to uncover the anomaly.
Explain the objective and the method of binning based on predictive value.
Why is binning based on predictive value considered to be somewhat of an art?
What step should precede the deriving of a new numerical variable representing the mean of two other numerical variables?
What does it mean to say that two variables are correlated?
Describe the possible consequences of allowing correlated variables to remain in the model.
A common practice among some analysts when they encounter two correlated predictors is to omit one of them from the analysis. Is this practice recommended?
Describe the strategy for handing correlated predictor variables at the EDA stage.
For each of the following descriptive methods, state whether it may be applied to categorical data, continuous numerical data, or both.a. Bar chartsb. Histogramsc. Summary statisticsd. Crosstabulationse. Correlation analysisf. Scatter plotsg. Web graphsh. Binning
Use the churn data set at the book series website for the following exercises. Make sure that the correlated variables have been accounted for.In view of the results obtained above, discuss the overall quality and adequacy of our churn classification models.
Use the churn data set at the book series website for the following exercises. Make sure that the correlated variables have been accounted for.Construct a single lift chart which includes the better of the two CART models, the better of the two C4.5 models, and the neural network model. Which model
Use the churn data set at the book series website for the following exercises. Make sure that the correlated variables have been accounted for.Based on your answer to Exercise 2, adjust the misclassification costs for your CART model to reduce the prevalence of the more costly type of error. Rerun
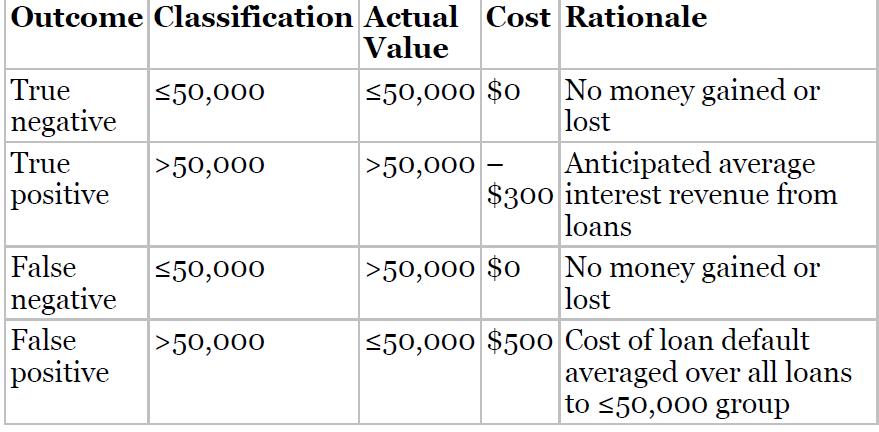
Use the churn data set at the book series website for the following exercises. Make sure that the correlated variables have been accounted for.Perform a cost/benefit analysis for the default CART model from exercise 1 as follows. Assign a cost or benefit in dollar terms for each combination of
Use the churn data set at the book series website for the following exercises. Make sure that the correlated variables have been accounted for.Perform a cost/benefit analysis for the CART model with the adjusted misclassification costs. Use the same cost/benefits assignments as for the default
Use the churn data set at the book series website for the following exercises. Make sure that the correlated variables have been accounted for.Construct a lift chart for the default CART model. What is the estimated lift at 20%? 33%? 40%? 50%?
Use the churn data set at the book series website for the following exercises. Make sure that the correlated variables have been accounted for.Construct a gains chart for the default CART model. Explain the relationship between this chart and the lift chart.
Use the churn data set at the book series website for the following exercises. Make sure that the correlated variables have been accounted for.Construct a lift chart for the CART model with the adjusted misclassification costs. What is the estimated lift at 20%? 33%? 40%? 50%?
Use the churn data set at the book series website for the following exercises. Make sure that the correlated variables have been accounted for.Construct a single lift chart for both of the CART models. Which model is preferable over which regions?
Use the churn data set at the book series website for the following exercises. Make sure that the correlated variables have been accounted for.Next, apply a neural network model to predict churn. Calculate the following measures.a. Proportion of false positives.b. Proportion of false negatives.c.
Use the churn data set at the book series website for the following exercises. Make sure that the correlated variables have been accounted for.Construct a lift chart for the neural network model. What is the estimated lift at 20%? 33%? 40%? 50%?
Explain the difference between supervised and unsupervised methods. Which data mining tasks are associated with unsupervised methods? Supervised? Both?
Should we strive for the highest possible accuracy with the training set? Why or why not? How about the validation set?
How is the bias–variance trade-off related to the issue of overfitting and underfitting? Is high bias associated with overfitting and underfitting, and why? High variance?
Suppose we are running a fraud classification model, with a training set of 10,000 records of which only 400 are fraudulent. How many fraudulent records need to be resampled if we would like the proportion of fraudulent records in the balanced data set to be 20%?
Explain why we should always report a baseline performance, rather than merely citing the uncalibrated results from our model.
Explain the distinction between reporting an absolute difference versus a relative difference.
If we are using a regression model, what form may our baseline model take?
Clearly describe what is meant by classification.
What is meant by the term instance-based learning?
Make up a set of three records, each with two numeric predictor variables and one categorical target variable, so that the classification would not change regardless of the value of k.
The example in the text regarding using the k-nearest neighbor algorithm for estimation has the closest record, overwhelming the other records in influencing the estimation. Suggest two creative ways that we could dilute this strong influence of the closest record.
Discuss the advantages and drawbacks of using a small value versus a large value for k.
What is locally weighted averaging, and how does it help in estimation?
Using the ClassifyRisk data set with predictors age, marital status, and income, and target variable risk, find the k-nearest neighbor for record #1, using k = 2 and Euclidean distance.
Using the ClassifyRisk data set with predictors age, marital status, and income, and target variable risk, find the k-nearest neighbor for record #1, using k = 2 and Minkowski (city-block) distance
Describe the possible situations when no further splits can be made at a decision node.
Suppose that our target variable is continuous numeric. Can we apply decision trees directly to classify it? How can we work around this?
True or false: Decision trees seek to form leaf nodes to maximize heterogeneity in each node.
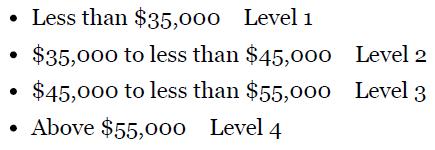
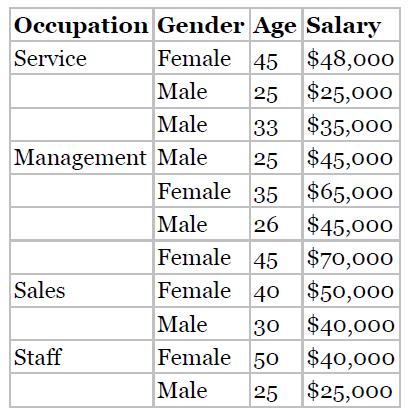
Discuss the benefits and drawbacks of a binary tree versus a bushier tree. Consider the data in Table 8.11. The target variable is salary. Start by discretizing salary as follows:Table 8.11 • Less than $35,000 Level 1 $35,000 to less than $45,000 $45,000 to less than $55,000 Above $55,000 Level
Construct a classification and regression tree to classify salary based on the other variables. Do as much as you can by hand, before turning to the software.
Construct a C4.5 decision tree to classify salary based on the other variables. Do as much as you can by hand, before turning to the software.
Compare the two decision trees and discuss the benefits and drawbacks of each.
Showing 200 - 300
of 261
1
2
3
Step by Step Answers