New Semester
Started
Get
50% OFF
Study Help!
--h --m --s
Claim Now
Question Answers
Textbooks
Find textbooks, questions and answers
Oops, something went wrong!
Change your search query and then try again
S
Books
FREE
Study Help
Expert Questions
Accounting
General Management
Mathematics
Finance
Organizational Behaviour
Law
Physics
Operating System
Management Leadership
Sociology
Programming
Marketing
Database
Computer Network
Economics
Textbooks Solutions
Accounting
Managerial Accounting
Management Leadership
Cost Accounting
Statistics
Business Law
Corporate Finance
Finance
Economics
Auditing
Tutors
Online Tutors
Find a Tutor
Hire a Tutor
Become a Tutor
AI Tutor
AI Study Planner
NEW
Sell Books
Search
Search
Sign In
Register
study help
business
discovering knowledge in data
Discovering Knowledge In Data An Introduction To Data Mining 2nd Edition Daniel T. Larose, Chantal D. Larose - Solutions
Generate the full set of decision rules for the C4.5 decision tree.
Compare the two sets of decision rules and discuss the benefits and drawbacks of each.
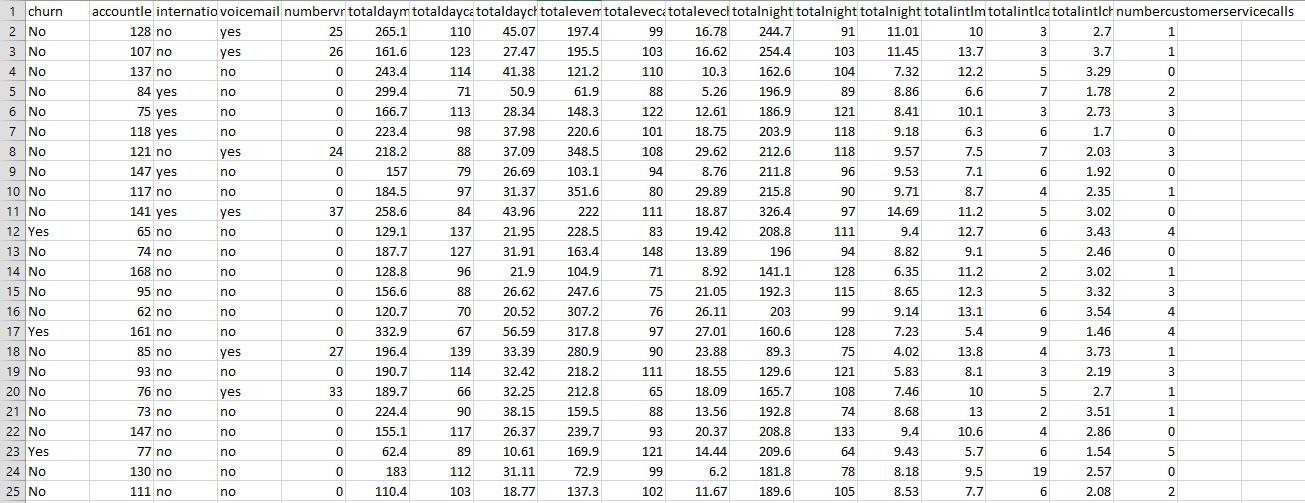
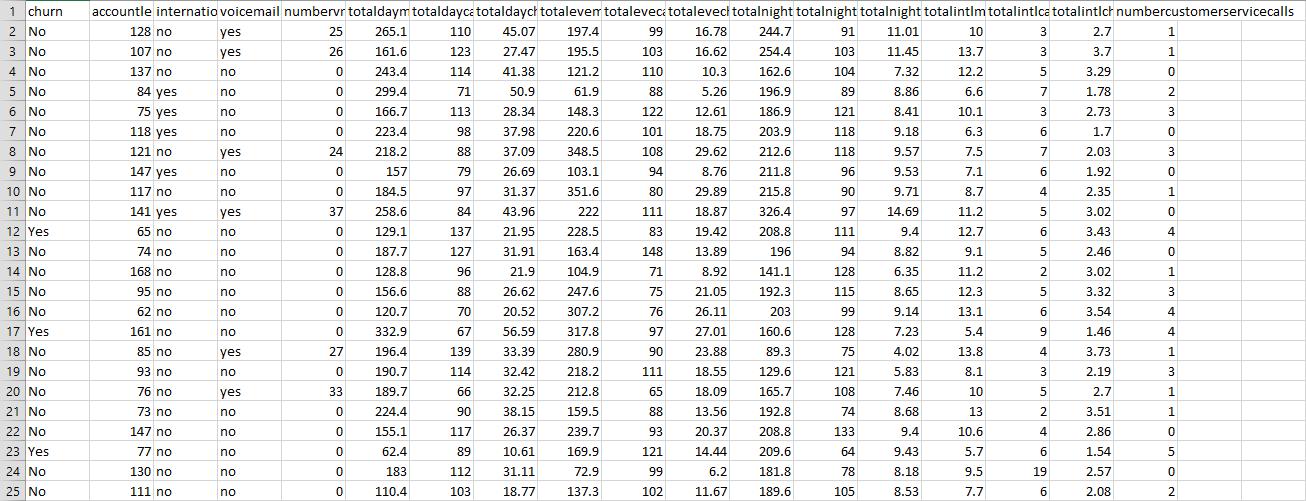
For the following exercises, use the churn data set available at the book series website. Normalize the numerical data and deal with the correlated variables.Generate a CART decision tree.Churn Data Set:
For the following exercises, use the churn data set available at the book series website. Normalize the numerical data and deal with the correlated variables.Generate a C4.5-type decision tree.
For the following exercises, use the churn data set available at the book series website. Normalize the numerical data and deal with the correlated variables.Compare the two decision trees and discuss the benefits and drawbacks of each.
For the following exercises, use the churn data set available at the book series website. Normalize the numerical data and deal with the correlated variables. Generate the full set of decision rules for the CART decision tree.
For the following exercises, use the churn data set available at the book series website. Normalize the numerical data and deal with the correlated variables.Generate the full set of decision rules for the C4.5 decision tree.
For the following exercises, use the churn data set available at the book series website. Normalize the numerical data and deal with the correlated variables.Compare the two sets of decision rules and discuss the benefits and drawbacks of each.
Clearly describe each of these characteristics of a neural network:a. Layeredb. Feedforwardc. Completely connected
What is the sole function of the nodes in the input layer?
Should we prefer a large hidden layer or a small one? Describe the benefits and drawbacks of each.
Explain why the updating term for the current weight includes the negative of the sign of the derivative (slope).
Adjust the weights W0B, W1B, W2B, and W3B from the example on back-propagation in the text.
Refer to Exercise 7. Show that the adjusted weights result in a smaller prediction error.Data From exercise 7Adjust the weights W0B, W1B, W2B, and W3B from the example on back-propagation in the text.
True or false: Neural networks are valuable because of their capacity for always finding the global minimum of the SSE.
Describe the benefits and drawbacks of using large or small values for the learning rate.
Describe the benefits and drawbacks of using large or small values for the momentum term.
For Exercises 12–14, use the data set churn. Normalize the numerical data, recode the categorical variables, and deal with the correlated variables.Generate a neural network model for classifying churn based on the other variables. Describe the topology of the model.
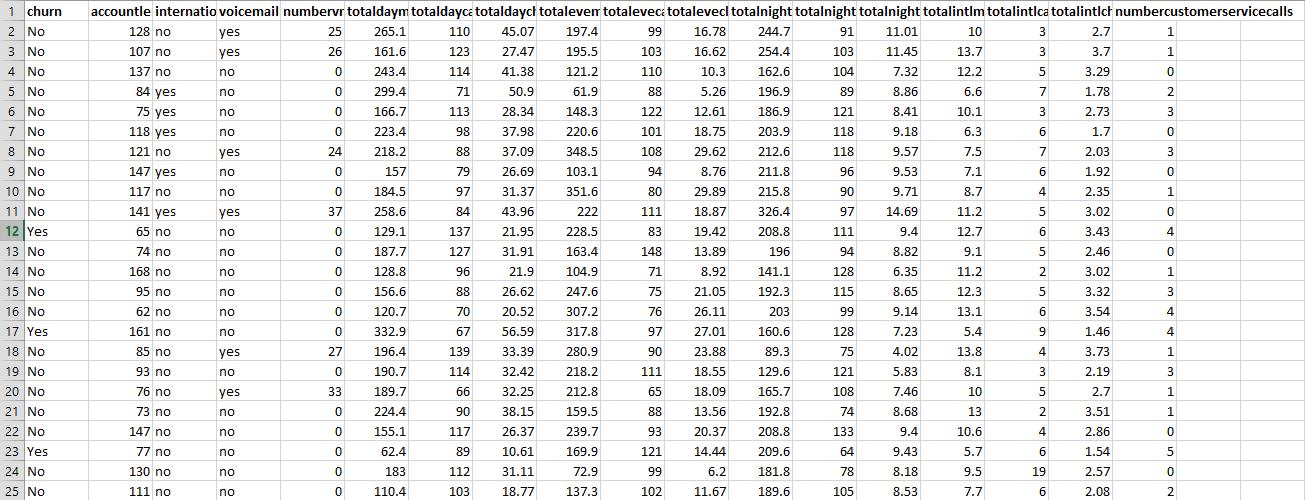
For Exercises 12–14, use the data set churn. Normalize the numerical data, recode the categorical variables, and deal with the correlated variables.Which variables, in order of importance, are identified as most important for classifying churn?Churn Data Set:
For Exercises 12–14, use the data set churn. Normalize the numerical data, recode the categorical variables, and deal with the correlated variables.Compare the neural network model with the CART and C4.5 models for this task in Chapter 6. Describe the benefits and drawbacks of the neural network
For Exercises 15–17, use the ClassifyRisk data set.Run an NN model predicting income based only on age. Use the default settings and make sure there is one hidden layer with one neuron.
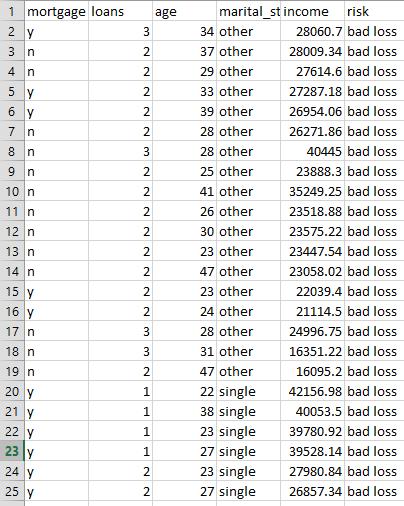
For Exercises 15–17, use the ClassifyRisk data set.Consider the following quantity: (weight for Age-to-Neuron1) + (weight for Bias-to-Neuron1) * (weight for Neuron 1-to-Output node). Explain whether this makes sense, given the data, and why.ClassifyRisk Data Set:
For Exercises 15–17, use the ClassifyRisk data set.Make sure the target variable takes the flag type. Compare the sign of (weight for Age-to-Neuron1) + (weight for Bias-to-Neuron1) * (weight for Neuron 1-to-Output node) for the good risk output node, as compared to the bad loss output node.
Set your neural network build options as follows: Use a Multilayer Perceptron and customize number of units in Hidden Layer 1 to be 1 and Hidden Layer 2 to be 0. For Stopping Rules, select ONLY Customize number of maximum training cycles. Start at 1 and go to about 20. For Advanced, deselect
Browse your model. In the Network window of the Model tab, select the Style: Coefficients. Record the Pred1-to-Neuron1 weight and the Pred2-to-Neuron1 weight for each run. Describe the behavior of these weights. Explain why this is happening.
To which cluster for the 90210 zip code would you prefer to belong?
Describe the goal of all clustering methods.
Suppose that we have the following data (one variable). Use single linkage to identify the clusters. Data: 0 0 1 3 3 6 7 9 10 10
Suppose that we have the following data (one variable). Use complete linkage to identify the clusters. Data: 0 0 1 3 3 6 7 9 10 10
What is an intuitive idea for the meaning of the centroid of a cluster?
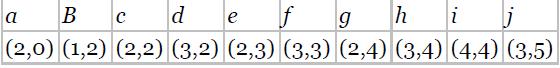
Refer to Exercise 6. Show that the ratio of the between-cluster variation to the within-cluster variation decreases with each pass of the algorithm.Exercise 6Suppose that we have the following data:Identify the cluster by applying the k-means algorithm, with k = 2. Try using initial cluster centers
Once again identify the clusters in Exercise 6 data, this time by applying the k-means algorithm, with k = 3. Try using initial cluster centers as far apart as possible.Exercise 6Suppose that we have the following data:Identify the cluster by applying the k-means algorithm, with k = 2. Try using
Refer to Exercise 8. Show that the ratio of the between-cluster variation to the within-cluster variation decreases with each pass of the algorithm.Exercise 8Once again identify the clusters in Exercise 6 data, this time by applying the k-means algorithm, with k = 3. Try using initial cluster
Which clustering solution do you think is preferable? Why?
Confirm the calculations for the second pass and third pass for MSB, MSE, and pseudo-F for Step Four of the example given in the chapter.
Use the cereals data set, included at the book series website, for the following exercises. Make sure that the data are normalized.Using all of the variables except name and rating, run the k-means algorithm with k = 5 to identify clusters within the data.
Use the cereals data set, included at the book series website, for the following exercises. Make sure that the data are normalized.Develop clustering profiles that clearly describe the characteristics of the cereals within the cluster.
Use the cereals data set, included at the book series website, for the following exercises. Make sure that the data are normalized.Rerun the k-means algorithm with k = 3.
Use the cereals data set, included at the book series website, for the following exercises. Make sure that the data are normalized.Which clustering solution do you prefer, and why?
Use the cereals data set, included at the book series website, for the following exercises. Make sure that the data are normalized.Develop clustering profiles that clearly describe the characteristics of the cereals within the cluster.
Use the cereals data set, included at the book series website, for the following exercises. Make sure that the data are normalized.Use cluster membership to predict rating. One way to do this would be to construct a histogram of rating based on cluster membership alone. Describe how the
Describe the two main methods of representing market basket data. What are the benefits and drawbacks of each?
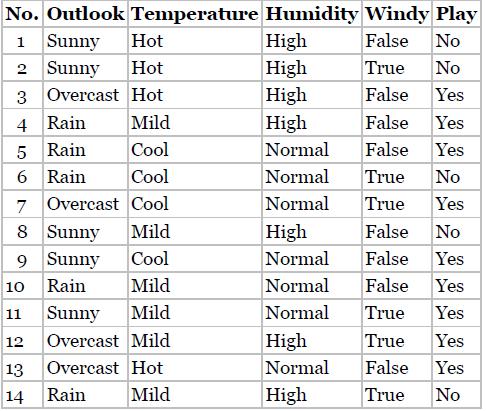
Restate the a priori property in your own words. For the following several exercises, consider the following data set from Quinlan [4] shown as Table 12.8. The goal is to develop association rules using the a priori algorithm for trying to predict when a certain (evidently indoor) game may be
Describe support and confidence. Express the formula for confidence using support.
Let φ = 3. Generate the frequent 1-itemsets.
Let φ = 3. Generate the frequent 2-itemsets.
Let φ = 3. Generate the frequent 3-itemsets.
Using 75% minimum confidence and 20% minimum support, generate one antecedent association rules for predicting play.
Using 75% minimum confidence and 20% minimum support, generate two antecedent association rules for predicting play.
Verify your manually found results using association rule software.
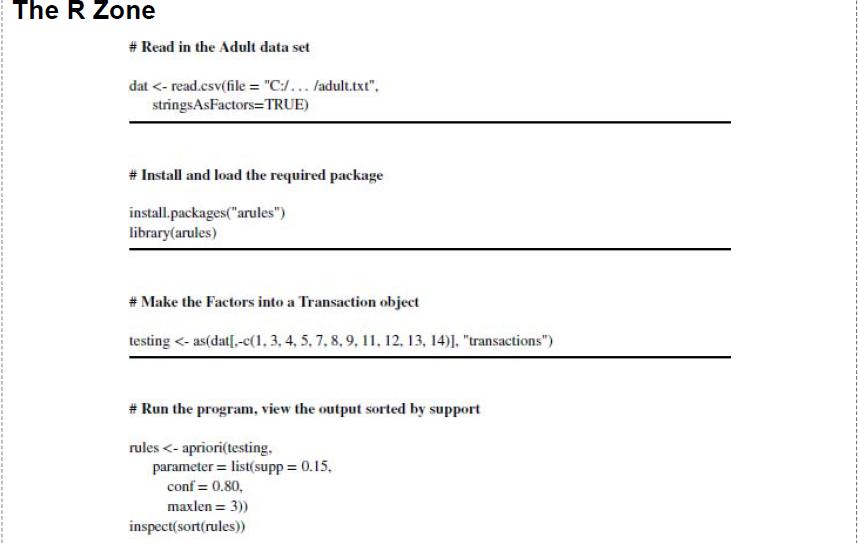
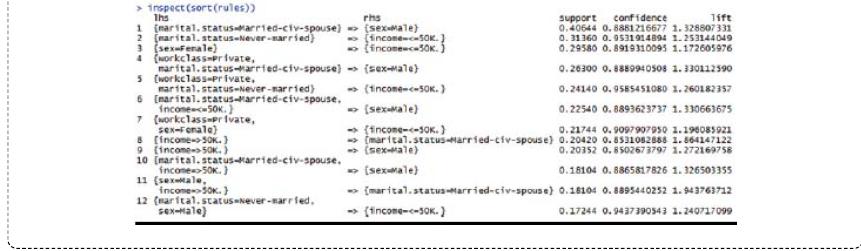
Find the value of the J-measure for the sixth rule from Figure 12.5. The R Zone # Read in the Adult data set dat
For each of the association rules found above by the a priori algorithm, find the J-measure. Then order the rules by J-measure. Compare the ordering with that from the a priori support × confidence ordering.
Use the churn data set, given at the book series website, for the following exercises. Use the Churn_Training_File. Filter out all variables except the following: VMail Plan, Intl Plan, CustServ Calls, and Churn. Set CustServ Calls to be ordinal. Allow the three predictors to be in either
Use the churn data set, given at the book series website, for the following exercises. Use the Churn_Training_File. Filter out all variables except the following: VMail Plan, Intl Plan, CustServ Calls, and Churn. Set CustServ Calls to be ordinal. Allow the three predictors to be in either
Use the churn data set, given at the book series website, for the following exercises. Use the Churn_Training_File. Filter out all variables except the following: VMail Plan, Intl Plan, CustServ Calls, and Churn. Set CustServ Calls to be ordinal. Allow the three predictors to be in either
Use the churn data set, given at the book series website, for the following exercises. Use the Churn_Training_File. Filter out all variables except the following: VMail Plan, Intl Plan, CustServ Calls, and Churn. Set CustServ Calls to be ordinal. Allow the three predictors to be in either
Use the churn data set, given at the book series website, for the following exercises. Use the Churn_Training_File. Filter out all variables except the following: VMail Plan, Intl Plan, CustServ Calls, and Churn. Set CustServ Calls to be ordinal. Allow the three predictors to be in either
Use the churn data set, given at the book series website, for the following exercises. Use the Churn_Training_File. Filter out all variables except the following: VMail Plan, Intl Plan, CustServ Calls, and Churn. Set CustServ Calls to be ordinal. Allow the three predictors to be in either
Why do we need to impute missing data?
When imputing a continuous variable, explain what we use for the set of predictors, and for the target variable.
When imputing a missing value, do we include the original target variable as one of the predictor variables for the data imputation model? Why or why not?
Describe what we should do if there are many variables with many missing values.
On your own, think of a data set where a potential pattern in missingness would represent good information.
State two methods for handling patterns in missingness.
Use the cereals data set for Exercises 7–12. Report the standard error of each imputation.Impute the potassium content of Almond Delight using multiple regression.
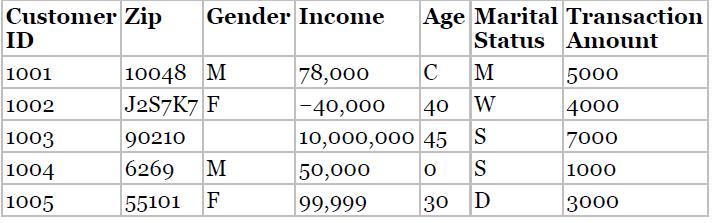
Refer to the income attribute of the five customers in Table 2.1, before preprocessing.a. Find the mean income before preprocessing.b. What does this number actually mean?c. Now, calculate the mean income for the three values left after preprocessing. Does this value have a meaning? Customer Zip
Use the cereals data set for Exercises 7–12. Report the standard error of each imputation.Impute the potassium content of Cream of Wheat.
Use the cereals data set for Exercises 7–12. Report the standard error of each imputation.Impute the carbohydrates value of Quaker Oatmeal.
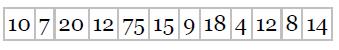
Use the following stock price data (in dollars) for Exercises 13–18.Find the min-max normalized stock price for the stock worth $20. 10 7 20 12 75 15 9 18 4 12 8 14
Use the cereals data set for Exercises 7–12. Report the standard error of each imputation.Impute the sugars value of Quaker Oatmeal.
Use the following stock price data (in dollars) for Exercises 13–18.Compute the Z-score standardized stock price for the stock worth $20. 10 7 20 12 75 15 9 18 4 12 8 14
Use the cereals data set for Exercises 7–12. Report the standard error of each imputation.Insert the value obtained in Exercise 10 for the sugars value of Quaker Oatmeal, and impute the carbohydrates value of Quaker Oatmeal.Data From Exercise 10Impute the sugars value of Quaker Oatmeal.
Use the churn data set at the book series website for the following exercises. Make sure that the correlated variables have been accounted for.Apply a CART model for predicting churn. Use default misclassification costs. Determine the following measures.a. Proportion of false positives.b.
Use the churn data set at the book series website for the following exercises. Make sure that the correlated variables have been accounted for.In a typical churn model, in which interceding with a potential churner is relatively cheap but losing a customer is expensive, which error is more costly,
Describe the possible negative effects of proceeding directly to mine data that has not been preprocessed.
Explain why zip codes should be considered text variables rather than numeric.
What is an outlier? Why do we need to treat outliers carefully?
Explain why a birthdate variable would be preferred to an age variable in a database.
True or false: All things being equal, more information is almost always better.
Explain why it is not recommended, as a strategy for dealing with missing data, to simply omit the records or fields with missing values from the analysis.
Which of the four methods for handling missing data would tend to lead to an underestimate of the spread (e.g., standard deviation) of the variable? What are some benefits to this method?
What are some of the benefits and drawbacks for the method for handling missing data that chooses values at random from the variable distribution?
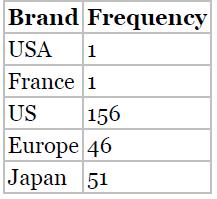
Make up a classification scheme which is inherently flawed, and would lead to misclassification, as we find in Table 2.2. For example, classes of items bought in a grocery store. Brand Frequency USA 1 France 1 US 156 Europe 46 Japan 51
Of the four methods for handling missing data, which method is preferred?
Use the following stock price data (in dollars) for Exercises 13–18.Compute the standard deviation of the stock price. Interpret what this number means. 10 7 20 12 75 15 9 18 4 12 8 14
Use the following stock price data (in dollars) for Exercises 13–18.Calculate the mean, median, and mode stock price. 10 7 20 12 75 15 9 18 4 12 8 14
Make up a data set, consisting of the heights and weights of six children, in which one of the children is an outlier with respect to one of the variables, but not the other. Then alter this data set so that the child is an outlier with respect to both variables.
Use the stock price data for Exercises 24–26.Do the following.a. Identify the outlier.b. Verify that this value is an outlier, using the Z-score method.c. Verify that this value is an outlier, using the IQR method. 10 7 20 12 75 15 9 18 4 12 8 14
Use the following stock price data (in dollars) for Exercises 13–18.Calculate the midrange stock price. 10 7 20 12 75 15 9 18 4 12 8 14
Use the stock price data for Exercises 24–26.Investigate how the outlier affects the mean and median by doing the following.a. Find the mean score and the median score, with and without the outlier.b. State which measure, the mean or the median, the presence of the outlier affects more, and why.
Use the following stock price data (in dollars) for Exercises 13–18.Find the decimal scaling stock price for the stock worth $20. 10 7 20 12 75 15 9 18 4 12 8 14
Calculate the skewness of the stock price data.
Explain why data analysts need to normalize their numeric variables.
Describe three characteristics of the standard normal distribution.
If a distribution is symmetric, does it follow that it is normal? Give a counterexample.
What do we look for in a normal probability plot to indicate nonnormality?
Use the stock price data for Exercises 24–26.Identify all possible stock prices that would be outliers, using:a. The Z-score method.b. The IQR method. 10 7 20 12 75 15 9 18 4 12 8 14
Bin the data into three bins of equal width (width = 3).
Use the following data set for Exercises 28–30:1, 1, 1, 3, 3, 7Clarify why each of the binning solutions above are not optimal.
Explain why we might not want to remove a variable just because it is highly correlated with another variable.
Showing 100 - 200
of 261
1
2
3
Step by Step Answers