

Question: Using the following data calculate the expected value, the standard deviation and the coecient of variation for each of the projects. Which project is the
Using the following data calculate the expected value, the standard deviation and the coe⁄cient of variation for each of the projects. Which project is the least risky and which is the most risky? Which project would a risk-averse individual and a risk-loving individual choose?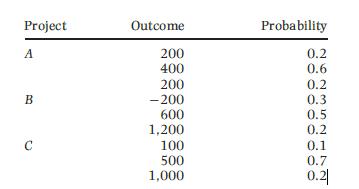
Project Outcome Probability A 200 0.2 400 0.6 200 0.2 B -200 0.3 600 0.5 1,200 0.2 C 100 0.1 500 0.7 1,000 0.21
Step by Step Solution
There are 3 Steps involved in it
1 Expert Approved Answer
Step: 1 Unlock

Question Has Been Solved by an Expert!
Get step-by-step solutions from verified subject matter experts
Step: 2 Unlock
Step: 3 Unlock