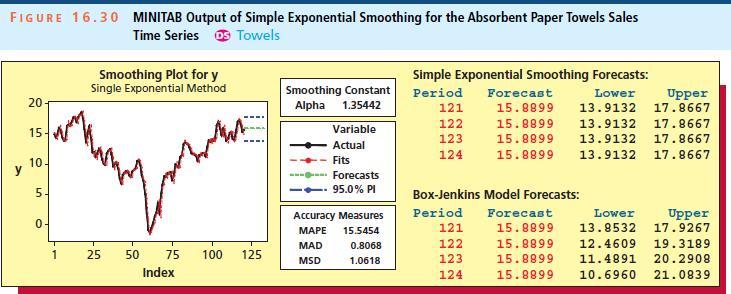
Figure 16.30 shows that the sales values in Table 16.22 are nonstationary and non seasonal. At the
Question:
Figure 16.30 shows that the sales values in Table 16.22 are nonstationary and non seasonal. At the non seasonal level (lags 1 through 9), the SAC of the regular differences of the sales values has a spike at lag 1 and cuts off after lag 1, and the SPAC of these regular differences dies down fairly quickly. Discuss why the guidelines in Section 16.6 say that a tentative Box–Jenkins model describing the regular differences
![]()
and thus that a tentative model describing yt is
![]()
Estimation shows that θ1 is important in the tentative model and that a constant term does not belong in the model. Diagnostic checking shows that the tentative model is adequate. Because the adequate Box–Jenkins model can be shown to be equivalent to simple exponential smoothing, it gives the same point forecasts. However, MINITAB calculates the Box–Jenkins model prediction intervals differently and obtains increasingly wide intervals (see Figure 16.30).
Data from Table 16.22

Data from Figure 16.30

Step by Step Answer:

Business Statistics In Practice
ISBN: 9780077534844
7th Edition
Authors: Bruce Bowerman, Richard OConnell, Emilly Murphree


