

Since 1994 a number of consumers have filed and won large claims against national fast-food chains as
Question:
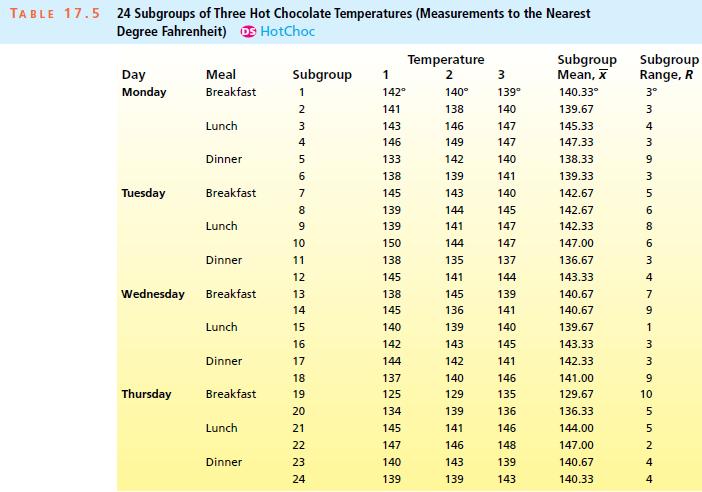
Since 1994 a number of consumers have filed and won large claims against national fast-food chains as a result of being scalded by excessively hot beverages such as coffee, tea, and hot chocolate. Because of such litigation, the food service staff at a university dining hall wishes to study the temperature of the hot chocolate dispensed by its hot chocolate machine. The dining hall staff believes that there might be substantial variations in hot chocolate temperatures from meal to meal. Therefore, it is decided that at least one subgroup of hot chocolate temperatures will be observed during each meal—breakfast (6:30 A.M. to 10 A.M.), lunch (11 A.M. to 1:30 P.M.), and dinner (5 P.M. to 7:30 P.M.). In addition, because the hot chocolate machine is heavily used during most meals, the dining hall staff also believes that hot chocolate temperatures might vary substantially from the beginning to the end of a single meal. It follows that the staff will obtain rational subgroups by selecting a subgroup a half hour after the beginning of each meal and by selecting another subgroup a half hour prior to the end of each meal. Specifically, each subgroup will be selected by pouring three cups of hot chocolate over a 10-minute time span using periodic sampling (the second cup will be poured 5 minutes after the first, and the third cup will be poured 5 minutes after the second). The temperature of the hot chocolate will be measured by a candy thermometer (to the nearest degree Fahrenheit) immediately after each cup is poured. Table 17.5 on the next page gives the results for 24 subgroups of three hot chocolate temperatures taken at each meal served at the dining hall over a four-day period. Here a subgroup consists of the three temperatures labeled 1 through 3 in a single row in the table.
Data from Table 17.5
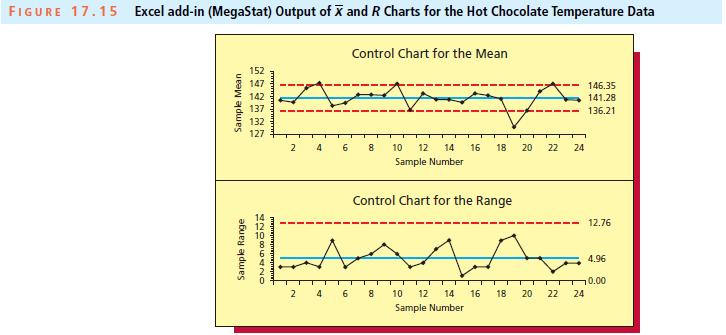
 The x̅ and R charts for these data are given in the Excel add-in (MegaStat) output in Figure 17.15.
a. Using the fact that x̅̅ = 141.28 and R̅ = 4.96, compute the control limits for the x̅ = and R charts and verify that they are as shown in Figure 17.15.
b. Is the R chart in statistical control? Explain.
c. Is the x̅ chart in statistical control? If not, use the x̅ chart to identify any out-of-control points.
Data from Figure 17.15
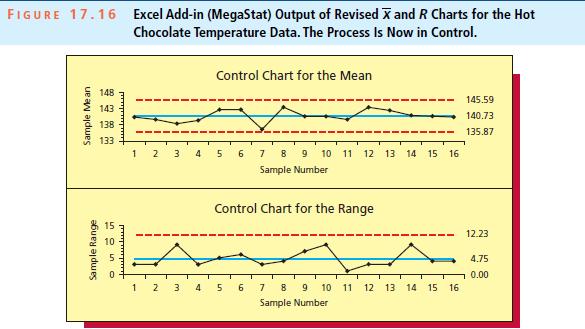
 d. Looking at the x̅ chart, we see that the subgroup means that are above the UCL were observed during lunch (note subgroups 4, 10, and 22). Investigation and process documentation reveal that on these days the hot chocolate machine was not turned off between breakfast and lunch. Discussion among members of the dining hall staff further reveals that, because there is less time between breakfast and lunch than there is between lunch and dinner or dinner and breakfast, the staff often fails to turn off the hot chocolate machine between breakfast and lunch. Apparently, this is the reason behind the higher hot chocolate temperatures observed during lunch. Investigation also shows that the dining hall staff failed to turn on the hot chocolate machine before breakfast on Thursday (see subgroup 19)—in fact, a student had to ask that the machine be turned on. This caused the subgroup mean for subgroup 19 to be far below the x̅ chart LCL. The dining hall staff concludes that the hot chocolate machine needs to be turned off after breakfast and then turned back on 15 minutes before lunch (prior experience suggests that it takes the machine 15 minutes to warm up). The staff also concludes that the machine should be turned on 15 minutes before each meal. In order to ensure that these actions are taken, an automatic timer is purchased to turn on the hot chocolate machine at the appropriate times. This brings the process into statistical control. Figure 17.16 shows x̅ and R charts with revised control limits calculated using the subgroups that remain after the subgroups for the out-of-control lunches (subgroups 3, 4, 9, 10, 21, and 22) and the out-of-control breakfast (subgroups 19 and 20) are eliminated from the data set. Are these revised control charts in statistical control? Explain.
Data from Figure 17.17
Step by Step Answer:
a b The R chart is in control since all the points are inside the control limits ...View the full answer


Business Statistics In Practice
ISBN: 9780077534844
7th Edition
Authors: Bruce Bowerman, Richard OConnell, Emilly Murphree
