

Question: 13. Figure 1.8 provides a bar graph summarizing the earnings for Volkswagen for the years 1997 to 2005 (BusinessWeek, December 26, 2005). a. Are the
13. Figure 1.8 provides a bar graph summarizing the earnings for Volkswagen for the years 1997 to 2005 (BusinessWeek, December 26, 2005).
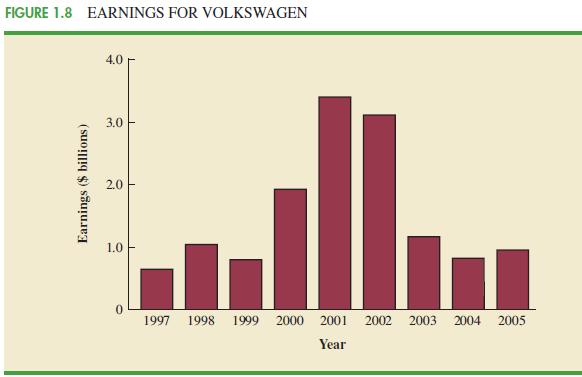
a. Are the data qualitative or quantitative?
b. Are the data time series or cross-sectional?
c. What is the variable of interest?
d. Comment on the trend in Volkswagen’s earnings over time. The BusinessWeek article (December 26, 2005) estimated earnings for 2006 at $600 million or $.6 billion. Does Figure 1.8 indicate whether this estimate appears to be reasonable?
e. A similar article that appeared in BusinessWeek on July 23, 2001, only had the data from 1997 to 2000 along with higher earnings projected for 2001. What was the outlook for Volkswagen’s earnings in July 2001? Did an investment in Volkswagen look promising in 2001? Explain.
f. What warning does this graph suggest about projecting data such as Volkswagen’s earnings into the future?
FIGURE 1.8 EARNINGS FOR VOLKSWAGEN Earnings ($ billions) 4.0 3.0 2.0 1.0 0 1997 1998 1999 2000 2001 2002 2003 2004 2005 Year
Step by Step Solution
There are 3 Steps involved in it

Get step-by-step solutions from verified subject matter experts