

Question: 46. Five observations taken for two variables follow. a. Develop a scatter diagram for these data. b. What does the scatter diagram indicate about a
46. Five observations taken for two variables follow.
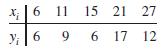
a. Develop a scatter diagram for these data.
b. What does the scatter diagram indicate about a relationship between x and y?
c. Compute and interpret the sample covariance.
d. Compute and interpret the sample correlation coefficient.
X 6 6 Yi 6 11 15 21 27 96 9 6 17 12
Step by Step Solution
There are 3 Steps involved in it
1 Expert Approved Answer
Step: 1 Unlock

Question Has Been Solved by an Expert!
Get step-by-step solutions from verified subject matter experts
Step: 2 Unlock
Step: 3 Unlock