

Question: 45. Five observations taken for two variables follow. a. Develop a scatter diagram with x on the horizontal axis. b. What does the scatter diagram
45. Five observations taken for two variables follow.
a. Develop a scatter diagram with x on the horizontal axis.
b. What does the scatter diagram developed in part
(a) indicate about the relationship between the two variables?
c. Compute and interpret the sample covariance.
d. Compute and interpret the sample correlation coefficient.
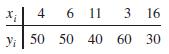
x4 6 11 3 16 y 50 50 40 60 30
Step by Step Solution
There are 3 Steps involved in it
1 Expert Approved Answer
Step: 1 Unlock

Question Has Been Solved by an Expert!
Get step-by-step solutions from verified subject matter experts
Step: 2 Unlock
Step: 3 Unlock