

Question: Consider a regression model that links a CEOs compensation (in $ millions) with the total assets of the firm (in $ millions) and the firms
Consider a regression model that links a CEO’s compensation (in $ millions) with the total assets of the firm (in $ millions) and the firm’s industry. Dummy variables are used to represent four industries: Manufacturing Technology d1, Manufacturing Other d2, Financial Services d3, and Nonfinancial Services d4. A portion of the data for the 455 CEOs is shown in the accompanying table. 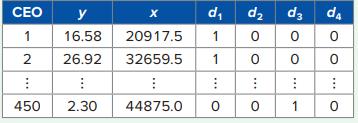
a. Estimate the model: y = β0 + β1x + β2d1 + β3d2 + β4d3 + ɛ, where y and x denote compensation and assets, respectively. Here the reference category is the nonfinancial services industry.
b. Interpret the estimated coefficients.
c. Use a 5% level of significance to determine which industries, relative to the nonfinancial services industry, have different executive compensation.
d. Reformulate the model to determine, at the 5% significance level, if compensation is higher in Manufacturing Other than in Manufacturing Technology. Your model must account for total assets and all industry types.
CEO 1 2 1 450 16.58 26.92 2.30 X 20917.5 32659.5 44875.0 d, dz d3 d4 1 0 0 0 1 0 # 0 0 0 I 0 0 1 *** 0 *** 0
Step by Step Solution
3.35 Rating (164 Votes )
There are 3 Steps involved in it
To address the regression analysis question lets break it down stepbystep a Estimate the Model The regression model is given by y beta0 beta1x beta2d1 ... View full answer

Get step-by-step solutions from verified subject matter experts