

Question: In Exercise D.46, we consider a regression model to use a students depression score to predict the number of classes missed in a semester. Here
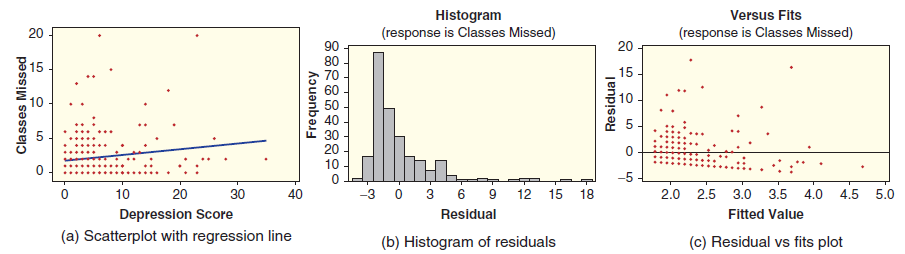
In Exercise D.46, we consider a regression model to use a student€™s depression score to predict the number of classes missed in a semester. Here we check the conditions for using that regression model. Three graphs for this model are shown in Figure D.5: the scatterplot with regression line, a histogram of the residuals, and a scatterplot of residuals against predicted values. Discuss whether the conditions are met. Be sure to comment on all three graphs.
Figure D.5
Exercise D.46
Is depression a possible factor in students missing classes? In Data D.1 on page 599, we introduce the data in SleepStudy. Two of the variables in that study are DepressionScore, scores on a standard depression scale with higher numbers indicating greater depression, and ClassesMissed, the number of classes missed during the semester. Computer output is shown for predicting the number of classes missed based on the depression score.
![Coefficients: Estimate Std. Error t value 1.77712 0.08312 Pr(> [t]) 6.652 1.79e-10 0.0142 (Intercept) 0.26714 *** 2.468](https://dsd5zvtm8ll6.cloudfront.net/si.question.images/images/question_images/1544/2/8/2/3545c0be0f2333051544264904553.jpg)
Residual standard error: 3.208 on 251 degrees of freedom
Multiple R-squared: 0.0237, Adjusted R-squared: 0.01981
F-statistic: 6.092 on 1 and 251 DF, p-value: 0.01424
Versus Fits (response is Classes Missed) Histogram (response is Classes Missed) 20 20 90 80 70 60 815 15 40 30 20 10 -5 -3 0 3 6 9 Residual 2.0 2.5 3.0 3.5 10 40 4.0 4.5 5.0 12 15 20 Depression Score (a) Scatterplot with regression line 30 18 Fitted Value (b) Histogram of residuals (c) Residual vs fits plot Classes Missed LO Frequency Residual Coefficients: Estimate Std. Error t value 1.77712 0.08312 Pr(> [t]) 6.652 1.79e-10 0.0142 (Intercept) 0.26714 *** 2.468 DepressionScore 0.03368
Step by Step Solution
3.41 Rating (160 Votes )
There are 3 Steps involved in it
There are several problems with the regression conditions the most serious of whic... View full answer

Get step-by-step solutions from verified subject matter experts