

Dereck Anderson is an institutional researcher at a major university. The university has set a goal to
Question:
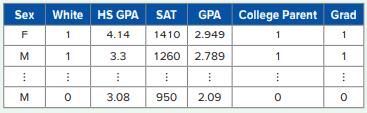
Dereck Anderson is an institutional researcher at a major university. The university has set a goal to increase the number of students who graduate within four years by 20% in five years. Dereck is asked by his boss to create a model that would flag any student who has a high likelihood of not being able to graduate within four years. He has compiled a data set of 2,000 previous students of the university that contains the following variables: sex (M/F), whether the student is Caucasian (White), high school GPA (HS GPA), SAT score (SAT), College GPA (GPA), whether the student’s parents are college educated (College Parent), and whether the student graduated within four years (Grad). A portion of the Graduate_Data worksheet is shown in the accompanying table. Build a default classification tree to predict whether the student will be able to graduate within four years (Grad). Display the classification tree.
a. What are the predictor variable and the split value for the first split of the default classification tree? State the rules that can be derived from the root node.
b. Build a full-grown tree. Which cp value is associated with the lowest cross-validation error?
c. Is there a simpler tree with a cross-validation error that is within one standard error of the minimum cross-validation error? If there is, then which cp value is associated with the best-pruned tree?
d. Prune the full tree to the best-pruned tree or the minimum error tree if the answer to part c is “No.” Display the tree. Is the pruned tree the same tree as the default tree created in a?
e. Create a confusion matrix and display the various performance measures. Assign Class 1 to be the positive class. What are the accuracy, sensitivity, specificity, and precision of the pruned tree on the validation data?
f. Generate the cumulative lift chart. Does the lift curve lie above the baseline? What does this mean?
g. Generate the ROC curve. What is the area under the ROC curve (or AUC value)? What does the AUC value imply?
h. Score the three university students in the Graduate_ Score worksheet using the pruned tree. How many of these three students will be able to graduate within four years according to your model?
Step by Step Answer:
To address each of your questions well use R with appropriate packages for c...View the full answer


Business Analytics Communicating With Numbers
ISBN: 9781260785005
1st Edition
Authors: Sanjiv Jaggia, Alison Kelly, Kevin Lertwachara, Leida Chen
