

The accompanying figure plots the monthly stock price of a large construction company from July 2017 through
Question:
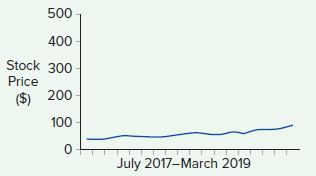
The accompanying figure plots the monthly stock price of a large construction company from July 2017 through March 2019. The stock has experienced tremendous growth over this time period, almost tripling in price. Does the figure reflect this growth? If not, why not?
Fantastic news! We've Found the answer you've been seeking!
Step by Step Answer:
This graph does not correctly depict what ...View the full answer

Answered By
PALASH JHANWAR
I am a Chartered Accountant with AIR 45 in CA - IPCC. I am a Merit Holder ( B.Com ). The following is my educational details.
PLEASE ACCESS MY RESUME FROM THE FOLLOWING LINK: https://drive.google.com/file/d/1hYR1uch-ff6MRC_cDB07K6VqY9kQ3SFL/view?usp=sharing
3+ Reviews
10+ Question Solved
Related Book For 

Business Analytics Communicating With Numbers
ISBN: 9781260785005
1st Edition
Authors: Sanjiv Jaggia, Alison Kelly, Kevin Lertwachara, Leida Chen
Question Posted:
