

The following table lists a portion of the average price (in $) for a gallon of gas
Question:
The following table lists a portion of the average price (in $) for a gallon of gas for the 50 states and the District of Columbia as reported by AAA Gas Prices on January 2, 2019.
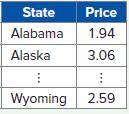
a. Construct the frequency distribution and the histogram for the average price of gas. Use six intervals with widths of 1.70 < x ≤ 2.00; 2.00 < x ≤ 2.30; etc. Which interval had the highest frequency? How many of the states had average gas prices greater than $2.60?
b. Is the distribution symmetric? If not, is it positively or negatively skewed?
Fantastic news! We've Found the answer you've been seeking!
Step by Step Answer:
a The interval 200 ...View the full answer

Answered By
HARSH RANJAN
Taken classes at college to graduates, Also worked as an expert to a freelancer online question-solving portal for more than 8 months with an average rating greater than 4.2 out of 5.
1+ Reviews
10+ Question Solved
Related Book For 

Business Analytics Communicating With Numbers
ISBN: 9781260785005
1st Edition
Authors: Sanjiv Jaggia, Alison Kelly, Kevin Lertwachara, Leida Chen
Question Posted:
