

The following table shows a portion of the monthly returns data (in percent) for 20102016 for two
Question:
The following table shows a portion of the monthly returns data (in percent) for 2010–2016 for two of Vanguard’s mutual funds: the Vanguard Energy Fund and the Vanguard Healthcare Fund.
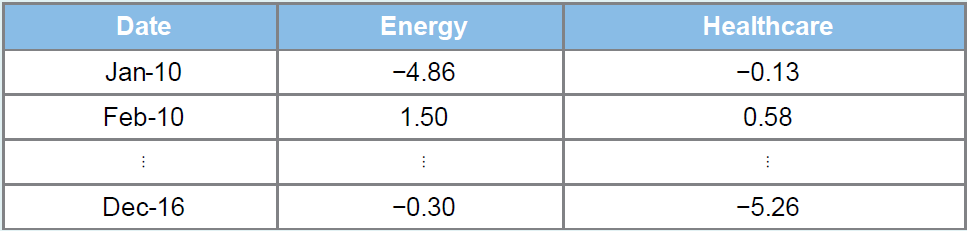
a. Calculate and interpret the sample correlation coefficient rxy.
b. Specify the competing hypotheses in order to determine whether the population correlation coefficient is different from zero.
c. At the 5% significance level, what is the conclusion to the test? Are the returns on the mutual funds correlated?
Mutual FundsMutual funds are like a pool of funds gathered by different small investors that have simalar investment perspective about returns on their investments. These funds are managed by professional investment managers who act smartly on behalf of the...
Fantastic news! We've Found the answer you've been seeking!
Step by Step Answer:
a The correlation coefficient is 04489 indicates a ...View the full answer

Answered By
Payal Mittal
I specialize in finance and accounts.You can ask any question related to til undergradution.Organizational behaviour and HRM are my favourites for you can always relate to them and is an art with practical knowledge base.
226+ Reviews
778+ Question Solved
Related Book For 
Business Statistics Communicating With Numbers
ISBN: 9781259957611
3rd Edition
Authors: Sanjiv Jaggia
Question Posted:
