

Question: Here is a scatterplot showing the regression line, 95% confidence interval, and 95% prediction interval, using 2005 youth unemployment data for a sample of 57
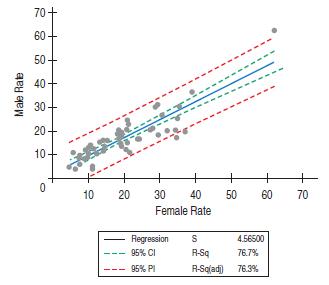
Here is a scatterplot showing the regression line, 95% confidence interval, and 95% prediction interval, using 2005 youth unemployment data for a sample of 57 nations. The response variable is the Male Rate, and the predictor variable is the Female Rate.
a) Explain the meaning of the 95% prediction interval in this context.
b) Explain the meaning of the 95% confidence interval in this context.
c) Identify the unusual observation, and discuss its potential impact on the regression.
70+ 60 50 40 + + + Male Rate 30 88 + 10 220 0 + + 10 20 30 40 50 60 70 Female Rate Regression S 4.56500 95% CI R-Sq 76.7% 95% Pl R-Sq(adj) 76.3%
Step by Step Solution
There are 3 Steps involved in it

Get step-by-step solutions from verified subject matter experts