

Question: Table 5.7 shows a small set of predictive model validation results for a classification model, with both actual values and propensities. a. Calculate error rates,
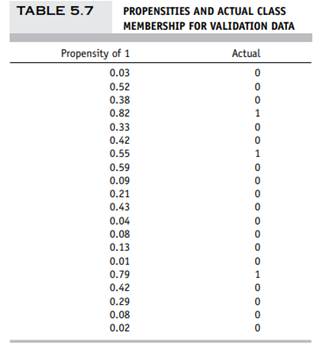
Table 5.7 shows a small set of predictive model validation results for a classification model, with both actual values and propensities.
a. Calculate error rates, sensitivity, and specificity using cutoffs of 0.25, 0.5, and 0.75.
b. Create a decile-wise lift chart in R.
Step by Step Solution
★★★★★
3.53 Rating (150 Votes )
There are 3 Steps involved in it
1 Expert Approved Answer
Step: 1 Unlock

To answer the question Ill go through each part stepbystep Part a Calculate error rates sensitivity ... View full answer
Question Has Been Solved by an Expert!
Get step-by-step solutions from verified subject matter experts
Step: 2 Unlock
Step: 3 Unlock