New Semester
Started
Get
50% OFF
Study Help!
--h --m --s
Claim Now
Question Answers
Textbooks
Find textbooks, questions and answers
Oops, something went wrong!
Change your search query and then try again
S
Books
FREE
Study Help
Expert Questions
Accounting
General Management
Mathematics
Finance
Organizational Behaviour
Law
Physics
Operating System
Management Leadership
Sociology
Programming
Marketing
Database
Computer Network
Economics
Textbooks Solutions
Accounting
Managerial Accounting
Management Leadership
Cost Accounting
Statistics
Business Law
Corporate Finance
Finance
Economics
Auditing
Tutors
Online Tutors
Find a Tutor
Hire a Tutor
Become a Tutor
AI Tutor
AI Study Planner
NEW
Sell Books
Search
Search
Sign In
Register
study help
business
statistics principles and methods
Statistics For The Health Sciences 1st Edition Christine Dancey, John Reidy, Richard Rowe - Solutions
3. Assume that general price rises and the consumption of bottled water is positively related. Which is the most sensible conclusion?a) Price rises lead to people drinking more bottled waterb) Consuming a lot of bottled water leads prices to risec) People drink more bottled water to help them cope
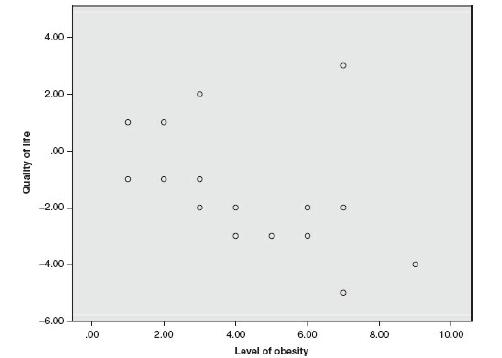
7. Look at the following scatterplot. This is an example of a:a) Positive relationshipb) Negative relationshipc) Zero relationshipd) Non-linear relationship 4.00- 2.00- .00 Quality of life -2.00 a -4.00- 0 0 -6.00 T T .00 2.00 4.00 T 6.00 8.00 10.00 Laval of obesity
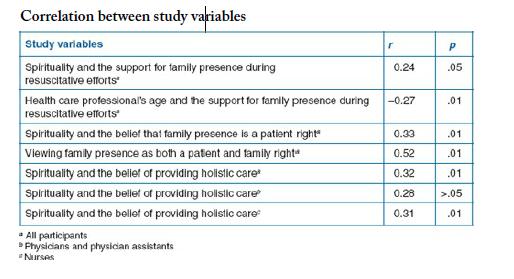
9. Which group had the strongest correlation between spirituality and the belief of providing holistic care?Question relate to the following table, taken from Baumhover and Hughes (2009), whose objective was to investigate the association between spirituality of health workers and their support for
10. Look at the relationship between the health care professional’s age and support for family presence during resuscitative efforts. The association means that the higher the age of the health care professional, the:Question relate to the following table, taken from Baumhover and Hughes (2009),
11. Which of the following correlations is not statistically significant at any acceptable level of significance?Question relate to the following table, taken from Baumhover and Hughes (2009), whose objective was to investigate the association between spirituality of health workers and their
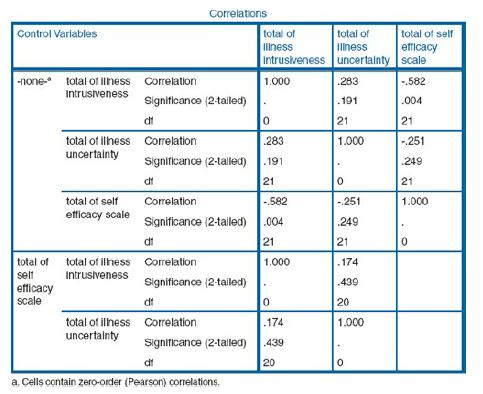
14. What is the zero-order correlation between illness uncertainty and illness intrusiveness?a) +.283b) +.174c) + 1.00d) +.439 Correlations Control Variables total of total of total of self Illness Illness efficacy Intrusiveness uncertainty scale Intrusiveness -none- total of Illness Correlation
15. The relationship between illness intrusiveness and illness uncertainty, with self-efficacy partialled out, is:a) +.439b) +.174c) +.283d) −1.00 Correlations Control Variables total of total of total of self Illness Illness efficacy Intrusiveness uncertainty scale Intrusiveness -none- total of
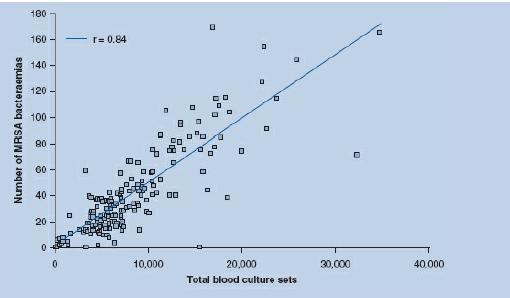
Look at the scatterplot in Figure 11.3 with regression lines, which is from the MRSA bacteriaemia surveillance in acute National Health Service Trusts in England from April 2002 to March 2003.Give the following information:a) The value of ab) The value of r2c) For every increase in 10,000 of total
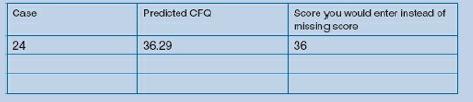
Fill in the Case Numbers, Predicted CFQ and the score you would enter instead of the missing score for the two other missing scores (this information is extracted from Screenshot 11.17. Answers are at the end of the book Case Predicted CFQ 24 36.29 Score you would enter instead of missing score 36
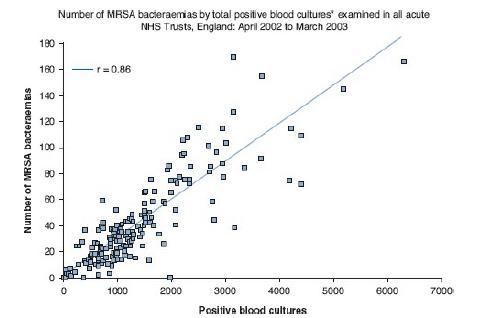
1. The value of a is:a) 0b) 1000c) 7000d) Cannot tell 180 Number of MRSA bacieraemias by total positive blood cultures' examined in all acute NHS Trusts, England: April 2002 to March 2003 160 r=0.86 140 120 Number of MRSA bacteraemias 100 80 60 8 20 L 1000 7 2000 3000 4000 5000 6000 7000
2. Calculate the slope of the line using the regression line in the scattergram above. The slope of the line,b, is approximately:a) 0.33b) 0.55c) 0.66d) 0.77 180 Number of MRSA bacieraemias by total positive blood cultures' examined in all acute NHS Trusts, England: April 2002 to March 2003 160
3. For a value of 5500 blood cultures, what is the (approximate) number of predicted MRSA bacteraemias?a) 100b) 120c) 140d) 160 180 Number of MRSA bacieraemias by total positive blood cultures' examined in all acute NHS Trusts, England: April 2002 to March 2003 160 r=0.86 140 120 Number of MRSA
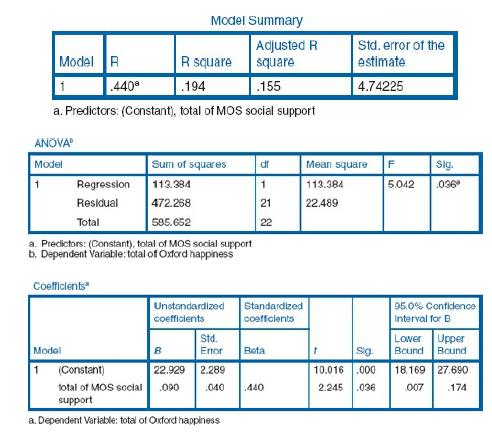
4. We are 95% confident that the true population regression line will fall between:a) 18.169 and 27.690b) .007 and .174c) 2.245 and 27.690d) None of the above Model Summary Adjusted R Model R R square square Std. error of the estimate 1 .440 .194 .155 4.74225 a. Predictors: (Constant), total of MOS
5. What is the correlation coefficient for the two variables?a) .440b) .194c) .155d) 4.74 Model Summary Adjusted R Model R R square square Std. error of the estimate 1 .440 .194 .155 4.74225 a. Predictors: (Constant), total of MOS social support ANOVA Model Sum of squares df Mean square F Sig.
6. Which statement is correct?a) The regression analysis is statistically significant (F1,22 = 5.042, p= .036)b) The regression analysis is statistically significant (F1,21 = 5.042, p = .036)c) The regression analysis is not statistically significant (F1,22 = 5.042, p = .036)d) The regression
7. The regression equation is ý = ?a) 2.289x + .040b) 22.929x + .09c) .09x + 22.929d) None of the above Model Summary Adjusted R Model R R square square Std. error of the estimate 1 .440 .194 .155 4.74225 a. Predictors: (Constant), total of MOS social support ANOVA Model Sum of squares df Mean
8. The standardised b weight is:a) .090b) .040c) .440d) 2.245 Model Summary Adjusted R Model R R square square Std. error of the estimate 1 .440 .194 .155 4.74225 a. Predictors: (Constant), total of MOS social support ANOVA Model Sum of squares df Mean square F Sig. Regression 113.384 1 113.384
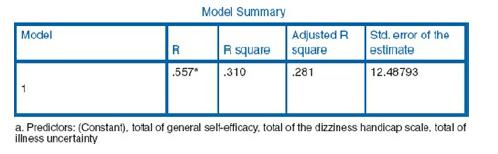
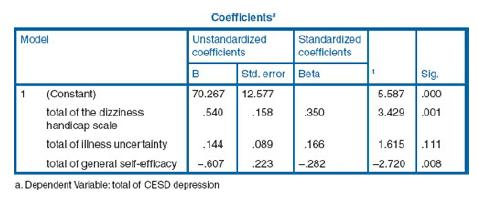
Question relate to a study of people with Menière’s Disease. The criterion variable is depression, and the predictor variables are general self-efficacy, Dizziness Handicap Scale and illness uncertainty.Look at the following model summary4. How much of the variation in depression scores can be
Question relate to a study of people with Menière’s Disease. The criterion variable is depression, and the predictor variables are general self-efficacy, Dizziness Handicap Scale and illness uncertainty.Look at the following model summary5. Which is the strongest predictor of depression?a)
Question relate to a study of people with Menière’s Disease. The criterion variable is depression, and the predictor variables are general self-efficacy, Dizziness Handicap Scale and illness uncertainty.Look at the following model summary6. Which of the following is true?a) As general
Questions relate to a study by Bramwell and Morland (2009) who studied genital appearance and satisfaction in women. As part of that study, they used a multiple regression to determine the contribution of appearance schemas, (a self-report measure relating to the importance of physical appearance
Questions relate to a study by Bramwell and Morland (2009) who studied genital appearance and satisfaction in women. As part of that study, they used a multiple regression to determine the contribution of appearance schemas, (a self-report measure relating to the importance of physical appearance
Question relate to a study by van der Colff and Rothmann (2009) who assessed whether or not occupational stress, sense of coherence and coping strategies predict burnout and the work engagement of registered nurses. The table below shows a multiple regression analysis with emotional exhaustion as
Question relate to a study by van der Colff and Rothmann (2009) who assessed whether or not occupational stress, sense of coherence and coping strategies predict burnout and the work engagement of registered nurses. The table below shows a multiple regression analysis with emotional exhaustion as
Question relate to a study by van der Colff and Rothmann (2009) who assessed whether or not occupational stress, sense of coherence and coping strategies predict burnout and the work engagement of registered nurses. The table below shows a multiple regression analysis with emotional exhaustion as
Question relate to a study by van der Colff and Rothmann (2009) who assessed whether or not occupational stress, sense of coherence and coping strategies predict burnout and the work engagement of registered nurses. The table below shows a multiple regression analysis with emotional exhaustion as
7. Which of the following would be suitable predictor variables in a logistic regression model?a) Heart rate (measured in beats per minute)b) Waist/hip ratio (cut into quintiles)c) Gender (male or female)d) All of the above The next questions refer to a study predicting the presence of depression
9. Does the model as a whole significantly improve prediction of depression relative to the baseline model?a) Nob) Yes, because the chi-square test is significantc) Yes, because the Nagalkerke R2 is above 0d) Yes because the −2 Log likelihood is positive The Variables in the Equation output from
15. If you had an exp(B) of −1.4 what would this mean?a) If you increase your predictor variable by one unit the odds of being in the condition coded as 1 would be 1.4 times lowerb) If you increase your predictor variable by one unit the odds of being in the condition coded as 1 would be 1.4
14. Which of the following are different approaches to calculating R2 type statistics for logistic regression:a) Wald testb) Nagelkerkec)d) Cox and Snelld)d) Bothb) andc) above
13. If the life events variable was standardised before running the analysis the effect would be:a) The overall model fit would changeb) The Wald significance test of the life events effect would changec) The odds-ratio for life events would changed) The odds-ratio for gender would change
12. We can be 95% confident that the population odds-ratio for life events falls between:a) We have no idea of the 95% confidence intervals from this outputb) 1.41 and 4.55c) .12 and 18.33d) .30 and 9.58
11. According to the Wald tests, which predictor(s) make a significant contribution to the model?a) Life eventsb) Genderc)a) and b)d) None of the predictors are significant
10. How are the Wald statistics calculated?a) The log-odds2/standard errorb) The log-odds/standard error2c) The (log-odds/standard error)2d) By thinking of a number and then doubling it
8. Why are there two degrees of freedom in the Omnibus Tests of Model Coefficients?a) Because depression can take on two possible valuesb) Because the baseline model contains two additional parametersc) Because the model including predictors contains two additional parametersd) Because gender can
6. In logistic regression, −2 Log likelihood measures:a) Model fit: the higher the value, the better the fitb) Model fit: the lower the value the better the fitc) The probability of a Type 1 errord) The chances of tripping over a log when running (multiplied by −2)
5. Log-odds can take on values between:a) – infinity and infinityb) 0 and 1c) 0 and infinityd) −1 and 1
4. In logistic regression the baseline model contains:a) A white line which you must stand behind when servingb) All your predictor variables and a constant termc) A constant but no predictor variablesd) All the predictor variables but no constant
3. If a continuous predictor variable has an odds-ratio of 1.4 in a logistic regression model, this implies that for every unit increase in the predictor:a) The probability of the outcome increases by 1.4b) The probability of the outcome is multiplied by 1.4c) The odds of the outcome increase by
2. Logistic regression can include which type of predictor variables?a) Continuousb) Categorical with only two possible valuesc) Categorical with three or more possible valuesd) a),b) andc) are all correct
1. Binary logistic regression may be used with the following types of outcome variables:a) Variables that take on one of two possible valuesb) Continuous variables scored on an interval scalec) Variables that take on one of many possible valuesd) Continuous variables scored on an interval-ratio
Let’s run the analysis in SPSS from the cardiac.sav dataset. We need to find the logistic regression dialogue box in the same way that we saw above. You should set up the dialogue box so it looks like Screenshot 13.9.
9. If a researcher has ten predictor variables, how many participants (approximately) should s/he have?a) 480b) 380c) 280d) 180
Look at the following text from Dingle and King (2009). They were looking at the impact of several variables on the outcome from a private hospital drug and alcohol treatment programme. As part of that study, they carried out a standard multiple regression to predict follow up % days abstinent
Look at the following text from Dingle and King (2009). They were looking at the impact of several variables on the outcome from a private hospital drug and alcohol treatment programme. As part of that study, they carried out a standard multiple regression to predict follow up % days abstinent
3. Which of these is not true?Researchers use hierarchical multiple regression when they:a) Want to control the order of entryb) Want to enter covariates into the modelc) Have theoretical reasons for entering variables into the programme in a specific orderd) Want to enter all the variables into
2. Which is not true? The predictor variables are also called the:a) Explanatory variablesb) Criterion variablesc) Independent variablesd) x variables
1. ý =value of:a) The criterion variableb) The predicted criterion variablec) The predictor variabled) Value of b
The above researchers produced a similar table using General Adjustment (a subscale of TAPES) as the criterion variable and seven explanatory (predictor) variables. Look at Table 12.7, and write a brief paragraph explaining the results. If you have understood the above paragraph, you shouldn’t
How would you explain the relationship of the perceived ‘risk to others’ and ‘frequency of handwashing’? In your explanation, make sure you talk about the unstandardised b weights, the standardised b weights, and the associated statistics. Compare your explanation to ours at the end of the
15. b means that: for every one-unit increase ina) y, x changes by one standard deviationb) x, y changes by one standard deviationc) x, y changes by a certain constant amountd) y, x changes by a certain constant amount
14. The constant is:a) The point at which the regression line crosses the x-axisb) The point at which the regression line crosses the y-axisc) The slope of the regression lined) None of the above
13. The slope of the regression line can be calculated by:a) Δx ÷ Δyb) Δy ÷ Δxc) Δy + Δxd) Δx – Δy
12. The general equation for a bivariate linear regression is: ý =a) bx + ab) ax + bc) a ÷ bxd) None of the above
11. Which of the following is not true in respect of a bivariate linear regression?a) The relationship between x and y should be linearb) The criterion variable should be drawn from a normally distributed population of scoresc) The predictor variable should be drawn from a normally distributed
10. A predictor variable is also known asa) The explanatory variableb) The criterion variablec)a) andb) aboved) Neithera) nor b)
9. Which of the following is not true?a) The regression line is known as the line of best fitb) b is the slope of the regression linec) a is the constantd) b is a standardised score
13. Assume there is a significant correlation between coping strategies and quality of life (+ .76, p < .001). Assume self-efficacy is then partialled out, and the correlation reduces to .21 (p = .70). Which is the most sensible conclusion?a) The relationship between coping strategies and quality
12. If, in a scatterplot, the datapoints are spread randomly, then the most likely correlation coefficient is:a) −.01b) −.35c) +.35d) −.46
8. As x increases, y increases. This is an example of a:a) Positive relationshipb) Negative relationshipc) Zero relationshipd) Non-linear relationship
6. As x increases, y decreases. This is an example of a:a) Positive relationshipb) Negative relationshipc) Zero relationshipd) Non-linear relationship
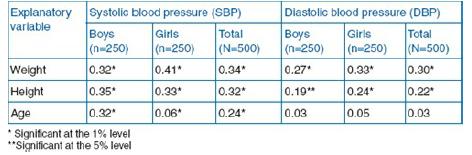
5. Which is the weakest correlation from the following SBP variable?a) Girls SBP and weightb) Girls SBP and agec) Boys SBP and weightd) Boys SBP and weight
4. Which is the strongest correlation from the following DBP variable?a) Girls DBP and weightb) Boys DBP and heightc) Girls DBP and heightd) Boys DPB and weight
2. If you wish to test the relationship between coping and quality of life, with depression controlled for (co-varied out) you would use:a) Cronbach’s alphab) Cohen’s kappac) Partial correlationd) Bivariate correlation
Gheissari et al. (2010) investigated the carotid intima-media thickness in children with end-stage renal disease on dialysis. As part of that study, they performed partial correlations.Look at the following text:After adjusting for age, partial correlation analysis showed significant correlation
12. A χ2 goodness-of-fit test is so named because ita) Tests whether observed frequencies are a good fit to the experimenter’s CVb) Tests whether the observed frequencies are a good fit to the specified expected frequenciesc) Tests whether the experimenter’s cardigan is the right sized) Tests
11. In SPSS you calculate a χ2 test for contingency tables viaa) Analyze, Descriptive Statistics, Crosstabsb) Analyze, Regression, Linearc) Analyze, Correlate, Bivariated) Analyze, Compare Means
10. What is meant by collapsing categories of a categorical variable?a) Combining two or more categories togetherb) The experimenter’s theoretical model is unsoundc) Hiding data that does not fit your hypothesisd) Removing observations that are outliers
9. What will the degrees of freedom be for a χ2 test of a 3×4 contingency table?a) 12b) 4c) 6d) 11
2. Fisher’s Exact Test is used when:a) A relative of Ronald Fisher is looking over your shoulderb) You have a 2×2 table and all the cells have an expected frequency above 5c) You have a 2×2 table and one or more cells has an expected frequency below 5d) You have a larger contingency table (e.g.
1. A researcher wants to know whether equal numbers of undergraduates consume alcohol in three different categories. In which order should the categories be entered to ensure the χ2 goodness-of-fit test can be correctly calculated?a) Teetotalers, healthy drinkers (less than 27 units per week),
What would the SPSS datasheet look like if you were setting up this analysis?
15. In a repeated-measures ANOVA, an appropriate overall measure of effect obtained by SPSS is:a) Partial eta2b) Cohen’s dc) Chi-squared) None of the above
14. A research group has four categories of self-reported smoking behaviour. There are differences in sample size and variance between the categories. The appropriate test to determine whether there are differences in the four independent groups is:a) One-way ANOVAb) Repeated-measures ANOVAc)
13. In the one-way ANOVA procedure, the Bonferroni test is:a) A type of fast carb) A post-hoc testc) A planned comparisond) None of the above
9. Which groups are not statistically significantly different from each other?a) IBD and controlsb) IBS and IBDc) IBS and controlsd) All of the above
8. Which is the most appropriate statement?a) There is a statistically significant effect of group on anxiety (F2,85 = 3.76; p = .027)b) There is a statistically significant effect of group on anxiety (F2,87 = 3.76; p = .027)c) There is no statistically significant effect of group on anxiety (F2,85
6. After performing an ANOVA and finding an overall significant difference, researchers need to find where the significant differences lie.They achieve this by performing a:a) t-testb) Least Significant Difference (LSD) testc) Tukey’s testd) Any of the above
5. A research group investigates three groups of patients; each group suffers from a rare disease and so participant numbers are small and the scores are not normally distributed. In addition, data are at the ordinal level. Which is the most appropriate test of difference?a) Kruskal–Wallis testb)
4. A researcher has four different groups of participants, measured on a scale which is interval level. The scores are normally distributed and the groups have similar variances. Which is the most appropriate test of difference?a) Kruskal–Wallis testb) Friedman’s ANOVAc) One-way
3. A researcher carries out five pairwise comparisons, and decides to adjust the criterion significance level to control for a Type I error. The most sensible probability level at which the findings should be declared statistically significant is:a)
2. In order to determine the strength of the difference between pairs of conditions using a parametric test, which is the most suitable?a) Cohen’s db) Eta2c) t-testd) Mann–Whitney
1. A test which looks for a significant difference between the mean ranks of three or more independent groups is called the:a) Mann-Whitney testb) Wilcoxon testc) Friedman’s ANOVAd) Kruskal–Wallis test
Carry out an appropriate pairwise test between fatigue at baseline and fatigue 12 months later. Report the appropriate statistics, and give an interpretation of the results. You may need to refer to Chapter 7. Compare this to our results in the answers section.
Which conditions are significantly different from each other? See the answers at the end of the book.
Using information from the descriptive statistics (above) calculate Cohen’s d for the significant comparisons above (correct to two decimal places) and state whether the effect is weak, moderate, or strong.Rewrite the reported results section above, this time incorporating the effect sizes. Check
A researcher wanted to determine whether there were significant differences in cortisol level between people with Chronic Fatigue Syndrome, those with Irritable Bowel Syndrome, those with Inflammatory Bowel Disease and those with Rheumatoid Arthritis.Identify both the independent variable and the
Here are some studies which show clearly the researchers are looking for differences between some or all of the three or more conditions.As you read them, think about whether the design is independent groups, or repeated measures. Check your answers at the back of the book.Scarpellini et al. (2008)
13. A researcher tests two groups of participants (N = 300) on a measure of stress (units: 1–20). If Cohen’s d is found to be 1.5 then the groups differ by:a) 1.5 standard deviationsb) 1.5 units of stressc) 150d) 15 SD
9. Which one of the following was traditionally not an assumption underlying the independent samples ttest:a) Scores must be drawn from a normally distributed populationb) Variances should be roughly equal in both groupsc) There should be a linear relationship between scores in condition 1 and
Ten people with Chronic Fatigue Syndrome rated their fatigue on a scale of 1–5 at two time points, before and after lunch. Data is skewed.8. The appropriate statistical test to analyse these data is:a) Independent t-testb) Wilcoxon signed ranks testc) Mann–Whitney testd) Paired t-test
Ten people with Chronic Fatigue Syndrome rated their fatigue on a scale of 1–5 at two time points, before and after lunch. Data is skewed.7. This is a:a) Two-group independent designb) Two-group repeated measures designc) Correlational designd) One sample z-test
6. A researcher carries out a t-test to analyse the differences between two conditions. She wishes to use a one-tailed hypothesis. The output from SPSS gives a two-tailed probability of 07. Which value should she use to report the one-tailed associated probability?a) .070b) .035c) .05d) .14
5. Levene’s test shows whether:a) Scores from two independent groups have roughly equal variancesb) Scores from one group of people performing in two conditions have equal variancesc) Scores are normally distributedd) All the of above
4. If Cohen’s d = 2.5, this is considered:a) A small effectb) A medium effectc) A large effectd) An impossible result
A researcher predicts that an exercise intervention with patients who have respiratory problems will improve physical function, measured by muscle force and oxygen uptake. There was an intervention (N = 20) and a control (N = 20) group.3. From those listed below, an appropriate statistical test to
A researcher predicts that an exercise intervention with patients who have respiratory problems will improve physical function, measured by muscle force and oxygen uptake. There was an intervention (N = 20) and a control (N = 20) group.2. This is a:a) Two-group independent designb) Two-group
1. If Cohen’s d = −.33 then:a) Groups differ by 3.3 SDb) Groups differ by a third of a SDc) Groups differ by less than 30% of a SDd) They do not differ
What conclusions can you draw from the above results section, in terms of evidence-based practice? Check your answer with ours at the end of the book
We asked the authors of this paper if we could have the SPSS data file so that we could use it as an exercise in this book, and they agreed. For the purposes of this exercise, we are going to ask you to carry out a Mann–Whitney test on their GHQ-12 data (see Table 7.13). Look at the data shown in
Showing 3700 - 3800
of 6202
First
31
32
33
34
35
36
37
38
39
40
41
42
43
44
45
Last
Step by Step Answers