

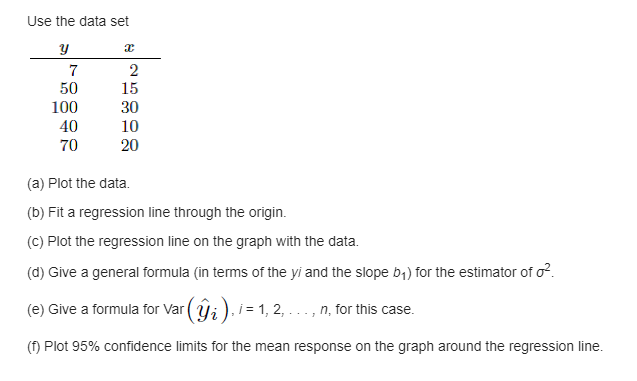
Question: kindly help to solve the question USE the data set 3; a: T 2 5t] 15 1011] 30 4t] 1t} 7t] '20 {3} Plot the
kindly help to solve the question
![T 2 5t] 15 1011] 30 4t] 1t} 7t] '20 {3} Plot](https://dsd5zvtm8ll6.cloudfront.net/si.experts.images/questions/2024/10/6708db9f7ce77_7596708db9f6f2ed.jpg)
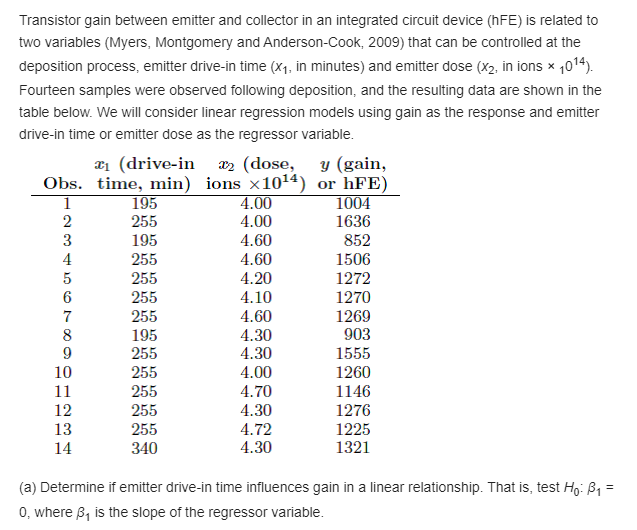
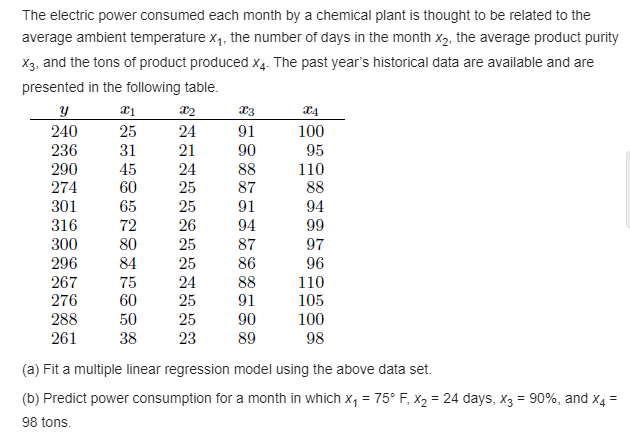
USE the data set 3; a: T 2 5t] 15 1011] 30 4t] 1t} 7t] '20 {3} Plot the data. {h} Fit a regression line through the origin. is} Plot the regression line on the graph with the data. {d} Give a general formula {in terms of the pi and the slope s1} for the esh'mator of 02. {e} owe a formula forVar (i ) r= 1, 2, . . . , n, for this case. if} Plot 95% condence limits for the mean response on the graph around the regression line. Test for linearity of regression in Exercise 11 .B on page 393. Comment 11 .B A mathematics plaoement test is given to all entering freshmen at a small college. A student who reoeiues a grade below 35 is denied admission to the regular mathematics course and placed in a remedial class. The placement test scores and the nal grades for 20 students who took the regular course were recorded. {a} Plot a scatter diagram. in) Find the equation of the regression line to predict course grades from placement test scores. {c} Graph the line on the scatter diagram. {d} If 60 is the minimum passing grade, below which plaoement test score should students in the future he denied admission to this course? Placement Tiest. Course Grade 51] 53 35 41 35 E 1 41] 5E 55 53 E5 35 35 l 1 t] Tl] Qt] T9 35 5Q Qt] 54 SD 91 t] 43 \fThe elecin'c power consumed each month bv a chemical plant is thought to be related to the average ambient temperature 11, the number of days in the month :2, the average product purity:r x3, and the tons of product produced 14. The past vear's historical data are available and are presented in the following table. 9 35 3E 3% 3M 249 25 24 91 199 235 31 21 99 95 299 45 24 33 1 19 224 59 25 ST 55 391 55 25 91 94 315 7'2 25 94 99 399 59 25 ST 9? 295 54 25 95 95 25? 7'5 24 SS 1 19 2'75 59 25 91 195 288 59 25 99 199 251 33 23 S9 98 {a} Fit a multiple linear regression model using the above data set. {b} Predict power consumption fora month in which x1 = T5\" F, x2 = 24 days, 13 = 90%, and x4 = SSIDHS. \fA new curing process developed for a certain type of cement results in a mean compressive strength of 5000 kilograms per square centimeter with a standand deviation of 12d kilograms. To test the hypothesis that pr = sooo against the altemaljve that pr a: 5, a random sample of 50 pieces of cement is tested. The critical region is dened to be it st: 4970. {a} Find the probability of committing a type I error 1llvhen Hi] is true. {h} Evaluate 18 for the altemaijves ,u = 49m and p = 495D. The average height of females in the freshman class of a certain college has histoncallyir been 162.5 centimeters with a standard deviation of 5.9 centimeters. Is there reason to believe that there has been a change in the average height if a random sample of 50 females in the present fresh man class has an average height of 165.2 centimeters? Use a Pvalue in your conclusion. Assu me the standard deviation remains the same
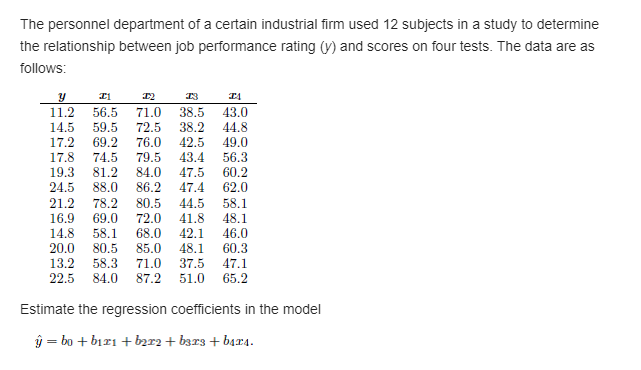
Step by Step Solution
There are 3 Steps involved in it

Get step-by-step solutions from verified subject matter experts