

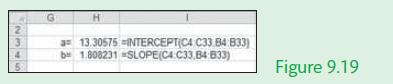
Question: Repeat Example 9.11, but this time use the Excel function INTERCEPT() and SLOPE() to calculate these values in Cells H3 and H4. Figure 9.19 illustrates
Repeat Example 9.11, but this time use the Excel function INTERCEPT() and SLOPE() to calculate these values in Cells H3 and H4. Figure 9.19 illustrates the change to cells H3 and H4 in the Excel solution given in Figure 9.17
Data from Example 9.11
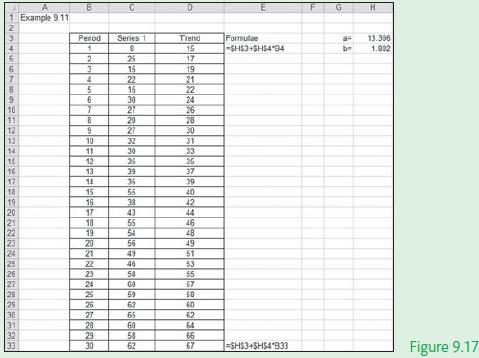
In this example we will fit a trend line to a time series data set given the value of the slope of the trend line and its intercept. Figure 9.17 illustrates the manual calculation of the trend line using basic Excel formulae.
3 5 H a=13.30575-INTERCEPT(C4 b 1.808231 SLOPE(C4 C33.84 B33) C33 84 833) Figure 9.19
Step by Step Solution
3.33 Rating (168 Votes )
There are 3 Steps involved in it
Excel solution Period Cells B4B... View full answer

Get step-by-step solutions from verified subject matter experts