

Question: In this example we will fit a trend line to a time series data set given the value of the slope of the trend line
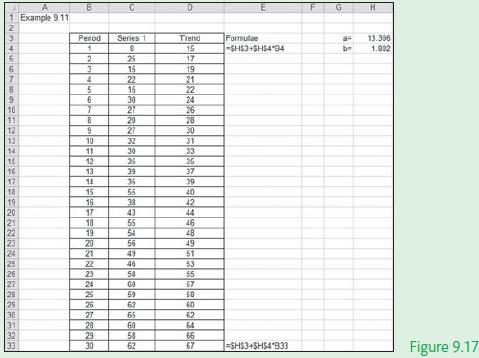
In this example we will fit a trend line to a time series data set given the value of the slope of the trend line and its intercept. Figure 9.17 illustrates the manual calculation of the trend line using basic Excel formulae.
1 Example 911 2 3 7 8 9 10 11 12 13 14 16 16 17 18 19 20 21 22 23 24 25 26 27 28 29 30 31 32 33 Perod 1 2 3 4 5 6 7 8 9 10 11 12 13 14 15 16 17 18 19 20 21 NATHENSAR Series 1 8 25 15 22 15 30 27 20 27 32 30 36 39 35 55 38 43 55 54 56 49 46 58 60 59 62 65 60 58 62 la Trend 16 17 19 21 22 24 26 28 30 31 33 35 37 39 40 42 44 46 48 49 51 53 55 57 58 60 62 64 66 67 Formulae -SH$3+5H54*34 -SH$3+SH54 B33 F 165 br 13.306 1.802 Figure 9.17
Step by Step Solution
3.42 Rating (155 Votes )
There are 3 Steps involved in it
Figure 917 indicates that we have put the value of the intercept in the cell ... View full answer

Get step-by-step solutions from verified subject matter experts