

A company selling wedding services needs to take into account the difference in age of the two
Question:
A company selling wedding services needs to take into account the difference in age of the two partners when marketing its services. The graph shows the ages of both men and women at first marriage (www.census.gov):
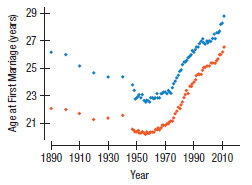
Clearly, the pattern for men is similar to the pattern for women. But are the two lines getting closer together?
Here is a timeplot showing the difference in average age (men’s age – women’s age) at first marriage, the regression analysis, and the associated residuals plot:
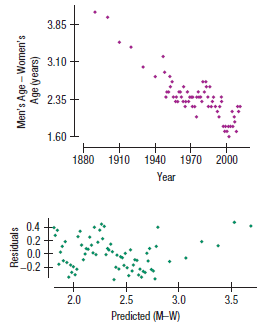
Dependent variable is: Age Difference
R-squared = 74.9% s = 0.2346
Variable Coeff
Constant......................32.9679
Year............................–0.01549
a) What is the correlation between Age Difference and Year?
b) Interpret the slope of this line.
c) Predict the average age difference in 2020.
d) Compute the Durbin-Watson statistic and comment.
e) Describe reasons why you might not place much faith in that prediction.
Step by Step Answer:
a The correlation between age difference and year is The negative value is used since the scatterplo...View the full answer


Business Statistics
ISBN: 9780133899122
3rd Canadian Edition
Authors: Norean D. Sharpe, Richard D. De Veaux, Paul F. Velleman, David Wright
