

The graph below shows the number of passengers travelling on major Canadian airlines month by month from
Question:
The graph below shows the number of passengers travelling on major Canadian airlines month by month from November 2010 to September 2015. Time is shown as months since October 2010.
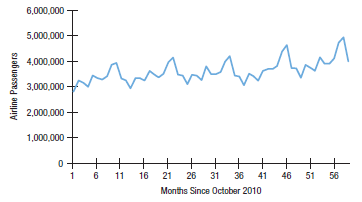
a) Perform a linear regression analysis of this data.
b) Interpret the slope, its P-value, and the R2.
c) Plot the residuals, calculate the Durbin-Watson statistic, and comment on what these imply for the regression model.
Fantastic news! We've Found the answer you've been seeking!
Step by Step Answer:
a Coefficients Standard Error t Stat Pvalue Intercept 1723720116 3504775425 4918204 778E06 ...View the full answer

Answered By
Pushpinder Singh
Currently, I am PhD scholar with Indian Statistical problem, working in applied statistics and real life data problems. I have done several projects in Statistics especially Time Series data analysis, Regression Techniques.
I am Master in Statistics from Indian Institute of Technology, Kanpur.
I have been teaching students for various University entrance exams and passing grades in Graduation and Post-Graduation.I have expertise in solving problems in Statistics for more than 2 years now.I am a subject expert in Statistics with Assignmentpedia.com.
3+ Reviews
10+ Question Solved
Related Book For 

Business Statistics
ISBN: 9780133899122
3rd Canadian Edition
Authors: Norean D. Sharpe, Richard D. De Veaux, Paul F. Velleman, David Wright
Question Posted:
