

A researcher is investigating the relationship between fuel economy and driving speed. He makes six runs on
Question:
A researcher is investigating the relationship between fuel economy and driving speed. He makes six runs on a test track, each at a di erent speed, and measures the kilometers traveled on one liter of fuel. The speeds (in kilometers per hour) and distances (in kilometers) are recorded below:
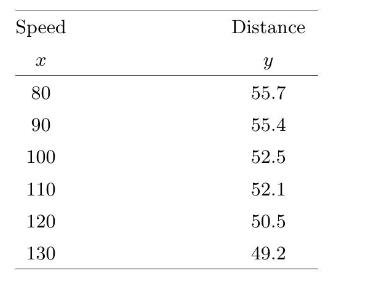
(a) Plot a scatterplot of distance travelled versus speed.
(b) Calculate the parameters of the least squares line.
(c) Graph the least squares line on your scatterplot.
(d) Calculate the estimated variance about the least squares line.
(e) Suppose that we know distance travelled, given that the speed is emphnormal \(\left(0+\quad x^{2}\right)\) where \({ }^{2}=57^{2}\) is known. Use a nor\(\operatorname{mal}\left(01^{2}\right)\) prior for . What is the posterior distribution of ?
(f) Perform a Bayesian test of
\[
H_{0}: \quad 0 \text { versus } H_{1}:\]
at the \(5 \%\) level of signi cance.
Step by Step Answer:

This question has not been answered yet.
You can Ask your question!

Introduction To Bayesian Statistics
ISBN: 9781118091562
3rd Edition
Authors: William M. Bolstad, James M. Curran
