

A study by the U.S. Small Business Administration modelled the GDP per capita of 24 of the
Question:
A study by the U.S. Small Business Administration modelled the GDP per capita of 24 of the countries in the Organisation for Economic Co-operation and Development (OECD). One analysis estimated the effect on GDP of economic regulations using an index of the degree of OECD economic regulation and other variables. The analyst found the following regression model:
Dependent variable is: GDP/Capita
R-squared = 97.4% R-squared (adjusted) = 96.6%
s = 2084 with 24 − 6 = 18 degrees of freedom
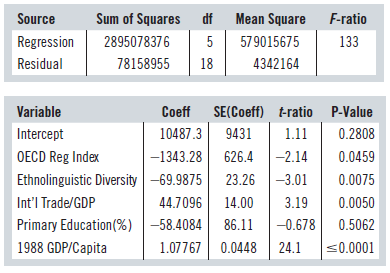
a) If we remove Primary Education from the model, the R2 decreases to 97.3%, but the adjusted R2 increases to 96.7%. How can that happen? What does it mean? Would you include Primary Education in this model?
Here’s a part of that regression:
Dependent variable is: GDP/Capita
R-squared = 97.3% R-squared (adjusted) = 96.7%
s = 2054 with 24$ – $5 = 19 degrees of freedom
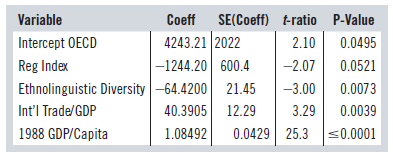
b) Consider the t-statistic for OECD Regulation in the reduced model. That was the predictor of interest to this author. Do you agree with his conclusion that OECD regulation reduced GDP/Capita in these countries? Why do you think he chose to include Primary Education as a predictor? Explain.
Step by Step Answer:
a Adjusted R 2 accounts for the number of predictors ...View the full answer


Business Statistics
ISBN: 9780133899122
3rd Canadian Edition
Authors: Norean D. Sharpe, Richard D. De Veaux, Paul F. Velleman, David Wright
