

A study of homes that looked at the relationship between Age of a home and Price produced
Question:
A study of homes that looked at the relationship between Age of a home and Price produced the following scatterplot. A regression was fit to the data, as shown:
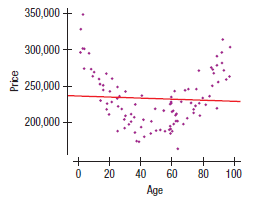
On the basis of this plot, would you advise using this regression? Explain.
Fantastic news! We've Found the answer you've been seeking!
Step by Step Answer:
No The scatterplot shows ...View the full answer

Answered By
Fahmin Arakkal
Tutoring and Contributing expert question and answers to teachers and students.
Primarily oversees the Heat and Mass Transfer contents presented on websites and blogs.
Responsible for Creating, Editing, Updating all contents related Chemical Engineering in
latex language
8+ Reviews
22+ Question Solved
Related Book For 

Business Statistics
ISBN: 9780133899122
3rd Canadian Edition
Authors: Norean D. Sharpe, Richard D. De Veaux, Paul F. Velleman, David Wright
Question Posted:
