

Question: Answer the following questions using the data from the Excel file grade inflation by semester.xlsx described in Problem 16.41: a. Forecast the average GPA for
Answer the following questions using the data from the Excel file grade inflation by semester.xlsx described in Problem 16.41:
a. Forecast the average GPA for each semester during 2018 using a multiple regression with seasonal dummy variables.
b. Interpret the meaning of the coefficients for the seasonal dummy variables.
c. Calculate the MAD for this forecast.
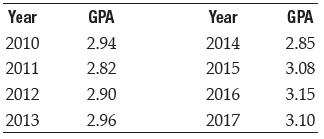
Year GPA Year GPA 2010 2.94 2014 2.85 2011 2.82 2015 3.08 2012 2.90 2016 3.15 2013 2.96 2017 3.10
Step by Step Solution
3.29 Rating (158 Votes )
There are 3 Steps involved in it
a Dummy Variables SD1 SD2 Fall 0 0 Spring 1 0 Summer 0 1 Set x 1 Period x 2 SD... View full answer

Get step-by-step solutions from verified subject matter experts