

Question: Bold names shown with a question identify the data table for the problem. Trust Gallup reported the following results from a survey in 2015. The
Trust Gallup reported the following results from a survey in 2015. The survey asked 1,527 adults to state how much they trust different institutions. This table summarizes the amount of trust placed in four groups.
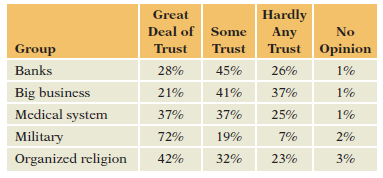
(a) Does this table show any association between the group and the amount of trust placed in the group? Interpret the category No Opinion as simply another category. (You might want to think about your answer to part (b) first.)
(b) Should these data be interpreted as a contingency table?
Hardly Any Trust Opinion Great Deal of Some No Group Trust Trust Banks 28% 45% 26% 1% Big business 1% 21% 41% 37% Medical system 37% 37% 25% 1% Military 72% 19% 2% Organized religion 42% 32% 23% 3%
Step by Step Solution
3.55 Rating (162 Votes )
There are 3 Steps involved in it
a The shown proportions differ in the rows of the table b... View full answer

Get step-by-step solutions from verified subject matter experts