

These data compare the on-time arrival performance of American and US Airways shortly before their merger in
Question:
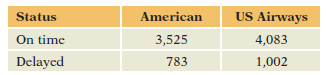
(a) On the basis of this initial summary, find the percentages (row or column) that are appropriate for comparing the on-time arrival rates of the two airlines. Which arrives on time more often?
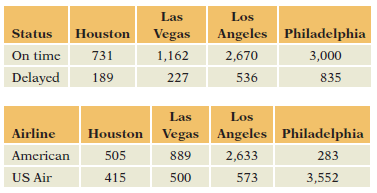
(b) The next two tables organize these same flights by destination. The first also shows arrival time and the second shows airline. Does it appear that a lurking variable might be at work here? How can you tell?
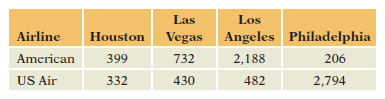
(c) Each cell of the following table shows the number of on-time arrivals for each airline at each destination. Is Destination a lurking factor behind the original 2 * 2 table?
Fantastic news! We've Found the answer you've been seeking!
Step by Step Answer:
a Use the column percentages American is doing better its ...View the full answer

Answered By
Ajeet Singh
Professional, Experienced, and Expert tutor who will provide speedy and to-the-point solutions.
I have been teaching students for 5 years now in different subjects and it's truly been one of the most rewarding experiences of my life.
I have also done one-to-one tutoring with 100+ students and help them achieve great subject knowledge.
I have expertise in computer subjects like C++, C, Java, and Python programming and other computer Science related fields.
Many of my student's parents message me that your lessons improved their children's grades and this is the best only thing you want as a teacher. I have done plenty of studying and lots of learning on many exciting and challenging topics. All these experiences have influenced my decision to take on the teaching role in various capacities. As a tutor, I am looking forward to getting to understand your needs and helping you achieve your academic goals. I'm highly flexible and contactable. I am available to work on short notice since I only prefer to work with very small and select groups of students.
7+ Reviews
15+ Question Solved
Related Book For 
Statistics For Business Decision Making And Analysis
ISBN: 9780134497167
3rd Edition
Authors: Robert A. Stine, Dean Foster
Question Posted:
