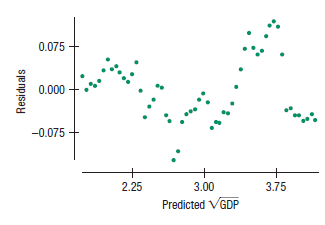
Consider again the post-1960 trend in U.S. GDP we examined in Exercise 57. Here are a regression
Question:
Consider again the post-1960 trend in U.S. GDP we examined in Exercise 57. Here are a regression and residual plot when we use the square root of GDP in the model. Is this a better model for GDP? Explain. (Data in GDP and DJIA 2017) Response variable is: 2GDP


Exercise 57

Transcribed Image Text:
Response variable is: VGDP R squared = 99.4% R squared (adjusted) = 99.4% s = 0.0554 with 57 - 2 = 55 degrees of freedom Variable Coefficient SE(Coeff) t-ratio P-value Intercept -83.2810 0.8867 -93.9 <0.0001 Year 0.043374 0.0004 97.2 <0.0001
Fantastic news! We've Found the answer you've been seeking!
Step by Step Answer:
Answer rating: 66% (9 reviews)
The R 2 is higher bu...View the full answer

Answered By

Asim farooq
I have done MS finance and expertise in the field of Accounting, finance, cost accounting, security analysis and portfolio management and management, MS office is at my fingertips, I want my client to take advantage of my practical knowledge. I have been mentoring my client on a freelancer website from last two years, Currently I am working in Telecom company as a financial analyst and before that working as an accountant with Pepsi for one year. I also join a nonprofit organization as a finance assistant to my job duties are making payment to client after tax calculation, I have started my professional career from teaching I was teaching to a master's level student for two years in the evening.
My Expert Service
Financial accounting, Financial management, Cost accounting, Human resource management, Business communication and report writing. Financial accounting : • Journal entries • Financial statements including balance sheet, Profit & Loss account, Cash flow statement • Adjustment entries • Ratio analysis • Accounting concepts • Single entry accounting • Double entry accounting • Bills of exchange • Bank reconciliation statements Cost accounting : • Budgeting • Job order costing • Process costing • Cost of goods sold Financial management : • Capital budgeting • Net Present Value (NPV) • Internal Rate of Return (IRR) • Payback period • Discounted cash flows • Financial analysis • Capital assets pricing model • Simple interest, Compound interest & annuities
4.40+
65+ Reviews
86+ Question Solved
Related Book For 

Business Statistics
ISBN: 9780134705217
4th Edition
Authors: Norean Sharpe, Richard Veaux, Paul Velleman
Question Posted:
Related Video
This activity is based on training and learning principles where the moderator is demonstrating to the participants how to make a paper Airplane. After the demonstration, participants are asked to fly their airplane to see which participant learned maximum from the activity
Students also viewed these Mathematics questions
-
The case study in Chapter 12 examined the effect of foreign competition in the automotive industry as the number of imported cars steadily increased during the 1970s and 1980s.10 The U.S. automobile...
-
Data set: WingLength2 If you completed the helicopter research project, this series of questions will help you further investigate the use of regression to determine the optimal wing length of paper...
-
Consider the QHIC data in Figure 13.21 (page 556). When we performed a regression analysis of these data by using the simple linear regression model, plots of the model's residuals versus x (home...
-
On the cost of goods manufactured schedule, depreciation onfactory equipment... A. is not listed because it is not a product cost. B. is not an inventoriable cost. C. is not listed because it is...
-
Use your knowledge of vectors to explain why, even though the C-Cl bond dipole is large, the dipole moment of carbon tetrachloride, CCl4, is zero.
-
Barth Company, which has been in business for three years, makes all of its sales on credit and does not offer cash discounts. Its credit sales, customer collections, and write-offs of uncollectible...
-
One critical-thinking skill is a heightened awareness of the danger of reaching a conclusion prior to acquiring missing information that were it known would have a reasonable probability of altering...
-
(Determine Proper Amounts in Account Balances) Presented below are three independent situations. (a) Chinook Corporation incurred the following costs in connection with the issuance of bonds: (1)...
-
Ho: 5. Now let's consider the effects of comparing responses across samples. Suppose that groups 1 and 2 used the same people, and that responses for individuals 1 to 8 are listed in each row....
-
Josephine Mater works for the supply-chain analytics division of Trader Joes, a national chain of specialty grocery stores. Trader Joes is considering a redesign of its supply chain. Josephine knows...
-
The US Department of Homeland Security is developing the Biometric Optical Surveillance System (BOSS). The purpose of the system, which consists of video cameras, computers, and a database of...
-
The Brown Electric Company uses the perpetual inventory system. Record these transactions in a two-column journal. 201X 3 Purchased 45 model 77 DX Light fixtures on account from Nonstop Electric at...
-
What factors must be considered in determining whether or not to record a liability for pending litigation? For threatened litigation?
-
Research the main hardware features that will support the things you want to be able to do on your new computer (at least 5).
-
Analyse in what respect are distributed computing systems better than parallel processing systems?
-
Write an assembly program that asks the user to input two digits and then the program adds them and outputs the result on the screen. Sample messages:
-
Jaypee has the following income in 2017: 10,000 interest income from a non-resident Japanese friend 40,000 interest income from Philippine residents 500,000 rent income from a commercial complex...
-
Regarding social etiquette in cyber communication, what are the hallmarks of the criteria that some believe account for digital civil discourse? How can abiding by proper social etiquette contribute...
-
Many experts believe that the Chinese currency should not only be revalued against the U.S. dollar as it was in July 2005, but also be revalued by 20% or 30%. What would be the new exchange rate...
-
How is use of the word consistent helpful in fraud reports?
-
The U.S. Census Bureaus 2007 Survey of Business Owners showed that 28.7% of all non-farm businesses are owned by women. You are phoning local businesses and assume that the national percentage is...
-
A manufacturer of clothing knows that the probability of a button flaw (broken, sewed on incorrectly, or missing) is 0.002. An inspector examines 50 shirts in an hour, each with 6 buttons. Using a...
-
Replacing the buttons with snaps increases the probability of a flaw to 0.003, but the inspector can check 70 shirts an hour (still with 6 snaps each). Now what is the probability she finds no snap...
-
There are two tabs to the excel Spreadsheet (also found on Wiley, but you are better off using the one attached to this assignment) . The first tab is the tab where you will place the ratios for the...
-
1. What is the par value of each common share? 2. What is the number of issued common shares at the end of fiscal year 2022? What is the number of outstanding common shares at the end of fiscal year...
-
Find log5,log4, and log20. Show that log20=log5+log4. What property of logarithms does this equality illustrate? What property of exponentiation does this property come from?

Study smarter with the SolutionInn App


