Consider Exercise 3.20. a. Compute and interpret the zscore for each total spending figure. b. Compute and
Question:
a. Compute and interpret the zscore for each total spending figure.
b. Compute and interpret the zscore for each spending per scholarship player figure.
Transcribed Image Text:
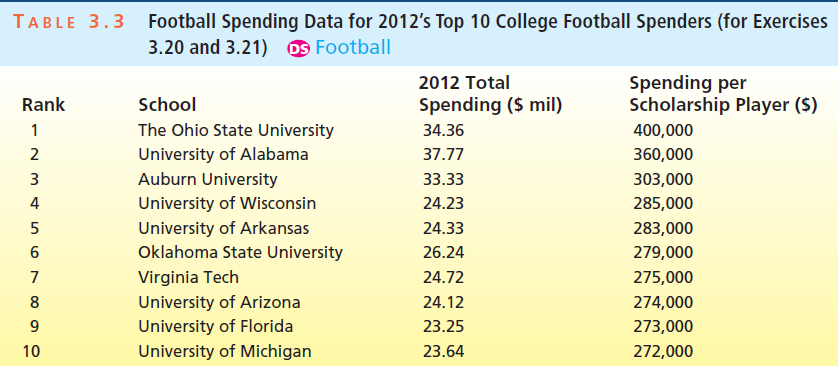
Football Spending Data for 2012's Top 10 College Football Spenders (for Exercises 3.20 and 3.21) os Football TABLE 3.3 2012 Total Spending per Scholarship Player ($) Rank School Spending ($ mil) The Ohio State University 34.36 400,000 University of Alabama 2 37.77 360,000 Auburn University University of Wisconsin 33.33 303,000 4 24.23 285,000 University of Arkansas 24.33 283,000 Oklahoma State University 26.24 279,000 Virginia Tech 24.72 275,000 University of Arizona 24.12 274,000 University of Florida 9. 23.25 273,000 University of Michigan 10 23.64 272,000
Fantastic news! We've Found the answer you've been seeking!
Step by Step Answer:
Answer rating: 80% (15 reviews)
a Total spending 27599 51075 round this to 5108 x x z x Interpretation 3436 6761 1324 x is 1324 stan...View the full answer
Answered By
Anurag Agrawal
I am a highly enthusiastic person who likes to explain concepts in simplified language. Be it in my job role as a manager of 4 people or when I used to take classes for specially able kids at our university. I did this continuously for 3 years and my god, that was so fulfilling. Sometimes I've skipped my own classes just to teach these kids and help them get their fair share of opportunities, which they would have missed out on. This was the key driver for me during that time. But since I've joined my job I wasn't able to make time for my passion of teaching due to hectic schedules. But now I've made a commitment to teach for at least an hour a day.
I am highly proficient in school level math and science and reasonably good for college level. In addition to this I am especially interested in courses related to finance and economics. In quest to learn I recently gave the CFA level 1 in Dec 19, hopefully I'll clear it. Finger's crossed :)
4.80+
2+ Reviews
10+ Question Solved
Related Book For
Business Statistics In Practice Using Data Modeling And Analytics
ISBN: 9781259549465
8th Edition
Authors: Bruce L Bowerman, Richard T O'Connell, Emilly S. Murphree
Question Posted:
Students also viewed these Mathematics questions
-
Consider Exercise 3.20. Nascar a. Compute and interpret the z- score for each Nascar team valuation. b. Compute and interpret the z- score for each Nascar team revenue.
-
Consider the international currency markets and, in particular, whether geographical proximity implies association with respect to market movements. Because FIGURE 11.3.5 FIGURE 11.3.6 the United...
-
The paper referenced in the previous exercise also gave data on the actual amount (in ml) poured into a short, wide glass for individuals asked to pour a shot of alcohol. a. Compute and interpret the...
-
Read the article Job Design, Job Characteristics, and Job Crafting and write a paper about it
-
Some economists believe that the U.S. economy as a whole can be modeled with the following production function, called the Cobb-Douglas production function: Y = AK1/3L2/3, where Y is the amount of...
-
Describe Generation Z. What differentiates it from other demographic groups, such as baby boomers, Generation X, and Millennials?
-
This exercise considers data from the Medical Expenditure Panel Survey (MEPS) described in Exercise 1.1 and Section 11.4. Our dependent variable consists of the number of outpatient (COUNTOP) visits....
-
The April 30 bank statement of Durkin Engineering Associates has just arrived from Maine First Bank. To prepare the Durkin bank reconciliation, you gather the following data: a. Durkins Cash account...
-
Oslo Company prepared the following contribution format income statement based on a sales volume of 1,000 units (the relevant range of production is 500 units to 1,500 units): Sales Variable expenses...
-
The balance sheet for Umi Sustainable Seafood Inc. reported the following components of equity on December 31, 2019: Common shares, unlimited shares authorized,20,800 shares issued and outstanding...
-
Table 3.3 gives spending data for the football programs at the 10 universities that spent the most money on football in 2012. Calculate the population range, variance, and standard deviation of the...
-
On its website, the Statesman Journal newspaper (Salem, Oregon, 2005) reports mortgage loan interest rates for 30 year and 15-year fixed-rate mortgage loans for a number of Willamette Valley lending...
-
Use Eq. (3) to find the length of the path over the given interval. (2t 2 , 3t 2 1), 0 t 4 = S= b. x(1) + y(1) di
-
What resources or financial counseling services are available to help navigate the costs and potential financial burdens associated with cancer treatment and how can you strategically plan and manage...
-
Solve for x 12.8(13x)4.14
-
Can you help me add these ideas to my final draft link: americanliterature.com/author/kate-chopin/short-story/the-storm. photo = information When analyzing a short story, it is essential to define...
-
Feldman argues that members of a discourse community have a responsibility to use the community's lexis (para. 6). Why does she say so? Does it seem strange to you to imagine a writer having a...
-
Explain marketability risk and marketability premium. Why is risk an increasing function of time? Discuss how the standard deviation, a statistical measure of dispersion, is used in investment...
-
The number of accidents on a highway is modeled as a Poisson process with parameter . Suppose exactly one accident has occurred by time t. If 0 < s < t, find the probability that accident occurred by...
-
Velshi Printers has contracts to complete weekly supplements required by fortysix customers. For the year 2018, manufacturing overhead cost estimates total $600,000 for an annual production capacity...
-
The data show the average wind speed for 36 days in a large city. Construct an ungrouped frequency distribution for the data. 10 15 10 8. 14 9. 8. 14 12 12 8. 8. 13 11 9. 10 11 8. 9. 13 13 10 8. 13
-
The data show the heights (in feet) of notable waterfalls in North America. Organize the data into a grouped frequency distribution using 6 classes. This data will be used for Exercises 7, 9, and 11....
-
Find the relative frequency for the frequency distribution for the data in Exercise 5. Data from 5 90 420 300 194 640 68 268 276 620 76 165 833 370 53 132 600 594 70 308 574 215 109 317 850 212 300...
-
make a scenario for each of the following Gesture communication Facial expression communication Oral communication Written communication discuss briefly each scenario
-
Problem 7-30 Holding Period Yield (LO2) The YTM on a bond is the interest rate you earn on your investment if interest rates don't change. If you actually sell the bond before it matures, your...
-
According to theknot.com, online dating is the most common way people meet their spouses today. This claim was based on a survey of 1,400 randomly selected recently married couples, with 266...
Study smarter with the SolutionInn App