

Question: Table 3.3 gives spending data for the football programs at the 10 universities that spent the most money on football in 2012. Calculate the population
Table 3.3 gives spending data for the football programs at the 10 universities that spent the most money on football in 2012. Calculate the population range, variance, and standard deviation of the 10 total football spending figures. Do the same for the 10 spending per scholarship player figures.
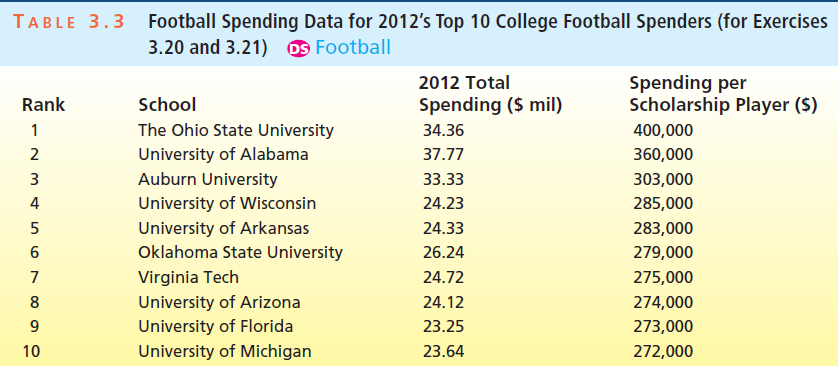
Football Spending Data for 2012's Top 10 College Football Spenders (for Exercises 3.20 and 3.21) os Football TABLE 3.3 2012 Total Spending per Scholarship Player ($) Rank School Spending ($ mil) The Ohio State University 34.36 400,000 University of Alabama 2 37.77 360,000 Auburn University University of Wisconsin 33.33 303,000 4 24.23 285,000 University of Arkansas 24.33 283,000 Oklahoma State University 26.24 279,000 Virginia Tech 24.72 275,000 University of Arizona 24.12 274,000 University of Florida 9. 23.25 273,000 University of Michigan 10 23.64 272,000
Step by Step Solution
3.35 Rating (158 Votes )
There are 3 Steps involved in it
Total spending Range Max Min 3777 2325 1452 mil x x x 2 3436 67... View full answer

Get step-by-step solutions from verified subject matter experts