

Question: Construct a scatterplot for each data set. Then calculate r and r2 for each data set. Interpret their values. a. -2 -1 0 1 2
Construct a scatterplot for each data set. Then calculate r and r2 for each data set. Interpret their values.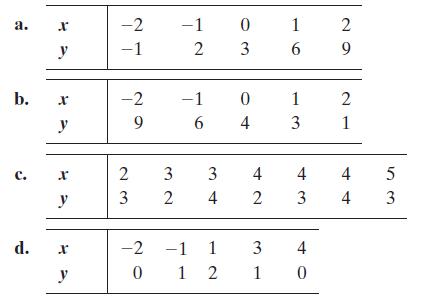
a. -2 -1 0 1 2 y -1 2 3 6 9 b. r -2 -1 0 1 2 y 9 6 4 3 1 c. r 23 3 3 4 4 4 5 y 3 2 4 2 3 4 3 d. x -2 -1 1 3 4 y 0 12 1 10
Step by Step Solution
There are 3 Steps involved in it
1 Expert Approved Answer
Step: 1 Unlock

Question Has Been Solved by an Expert!
Get step-by-step solutions from verified subject matter experts
Step: 2 Unlock
Step: 3 Unlock