

Question: Does elevation affect hitting performance in baseball? Refer to the Chance (Winter 2006) investigation of the effects of elevation on slugging percentage in Major League
Does elevation affect hitting performance in baseball?
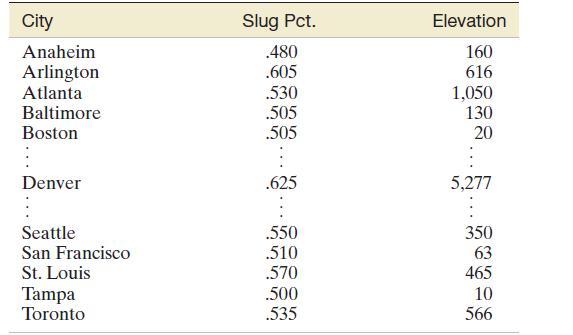
Refer to the Chance (Winter 2006) investigation of the effects of elevation on slugging percentage in Major League Baseball, Exercise 2.160 (p. 124). Data were compiled on players’ composite slugging percentages at each of 29 cities for the 2003 season, as well as on each city’s elevation
(feet above sea level). The data are saved in the PARKS file. (Selected observations are shown in the table below.)
Consider a straight-line model relating slugging percentage
(y) to elevation (x).
a. The model was fit to the data with the use of MINITAB, with the results shown in the printout below. Locate the estimates of the model parameters on the printout.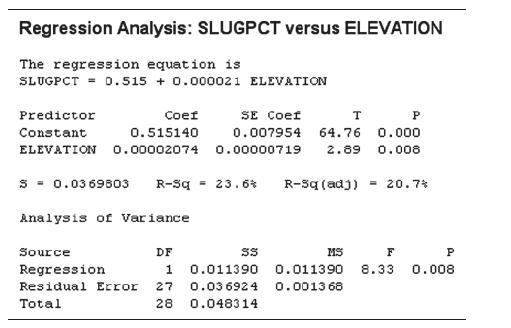
b. Is there sufficient evidence (at a = .01) of a positive linear relationship between elevation (x) and slugging percentage (y)? Use the p-value shown on the printout to make the inference.
c. Construct a scatterplot of the data and draw the least squares line on the graph. Locate the data point for Denver on the graph. What do you observe?
d. Recall that the Colorado Rockies, who play their home games in Denver, are annually among the league leaders in slugging percentage. Baseball experts attribute this to the “thin air” of Denver—called the Mile High city due to its elevation. Remove the data point for Denver from the data set and refit the straight-line model to the remaining data. Repeat parts a and
b. What conclusions can you draw about the “thin air” theory from this analysis?
Regression Analysis: SLUGPCT versus ELEVATION The regression equation is SLUGPCT = 0.515 +0.000021 ELEVATION Predictor Constant ELEVATION Coef SE Coef T P 0.515140 0.007954 64.76 0.000 0.00002074 0.00000719 2.89 0.008 5 = 0.0369503 R-Sq = 23.6% R-5q (adj) 20.7% Analysis of Variance Source Regression DF SS MS F P 1 0.011390 0.011390 8.33 0.008 Residual Error 27 0.036924 0.001368 Total 28 0.048314
Step by Step Solution
There are 3 Steps involved in it

Get step-by-step solutions from verified subject matter experts