

Question: Construct a scattergram tor each data set. Then calculate r and r2 tor each data set. interpret their values. Complete parts a through d. a.
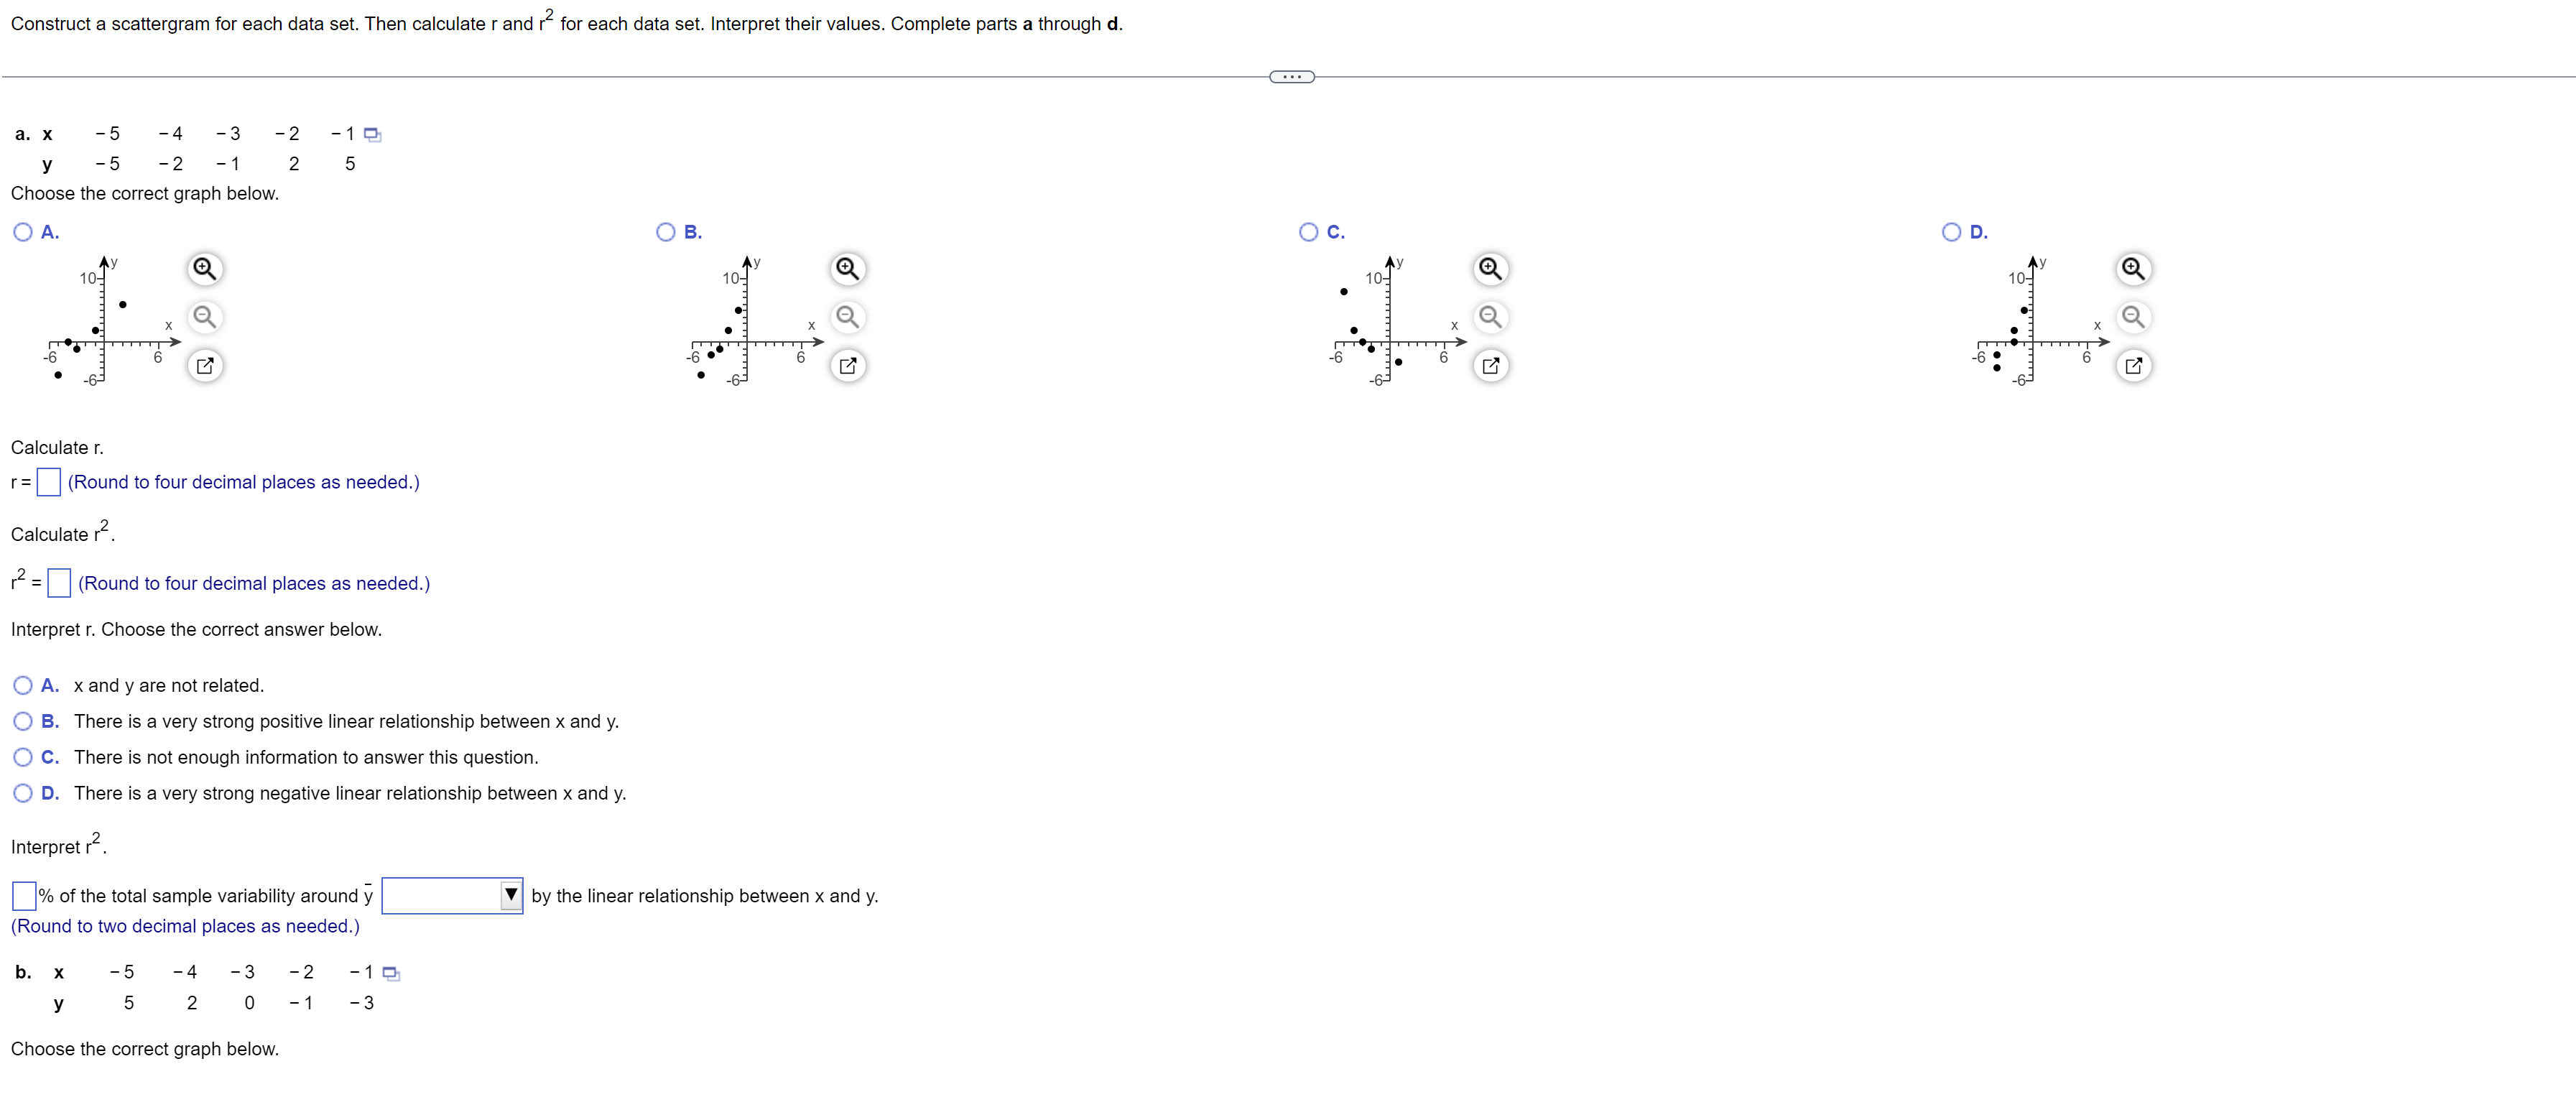
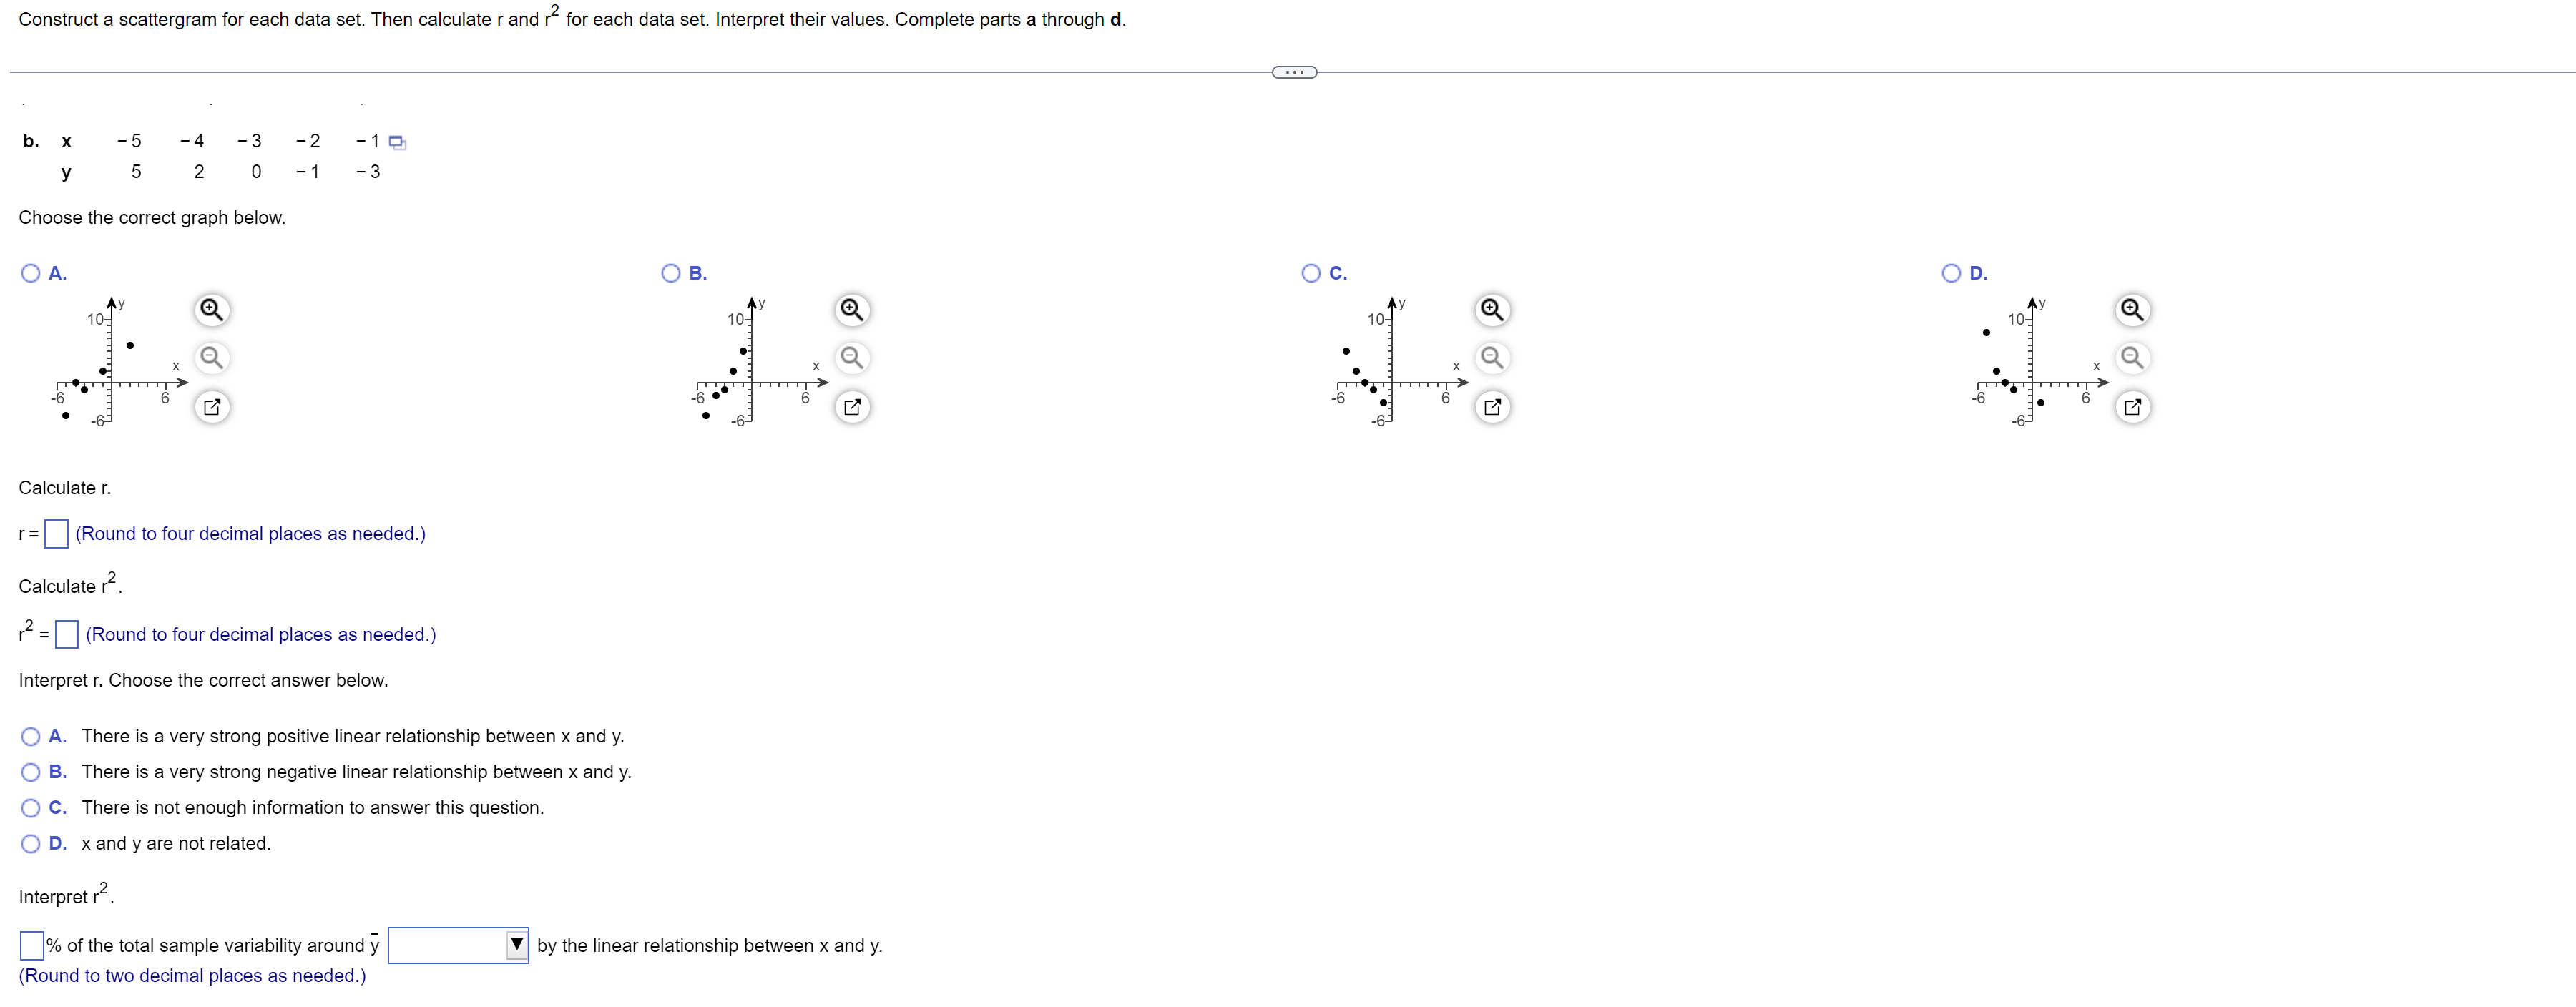
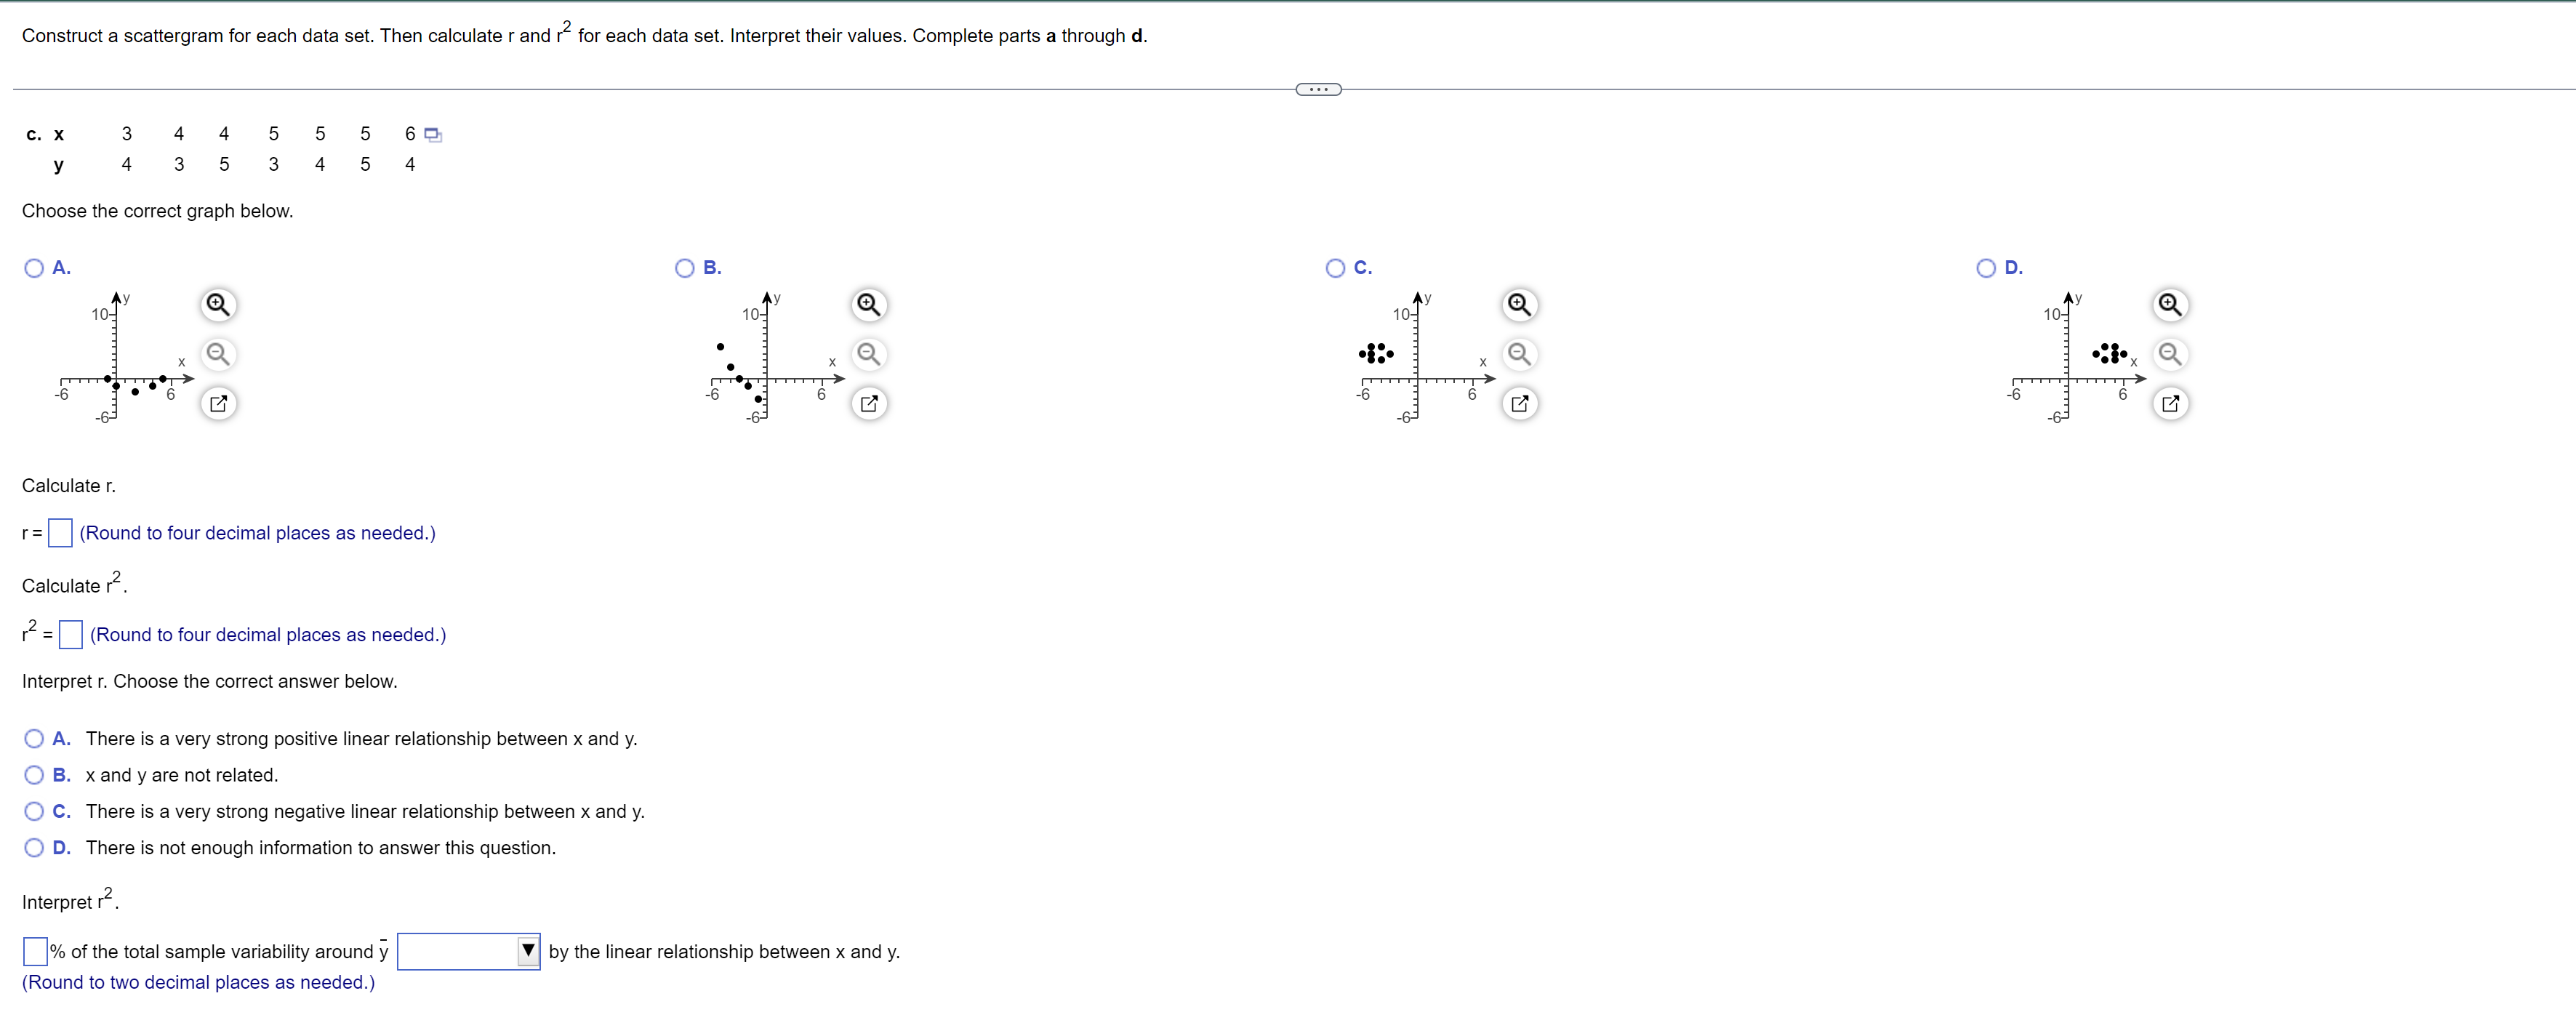
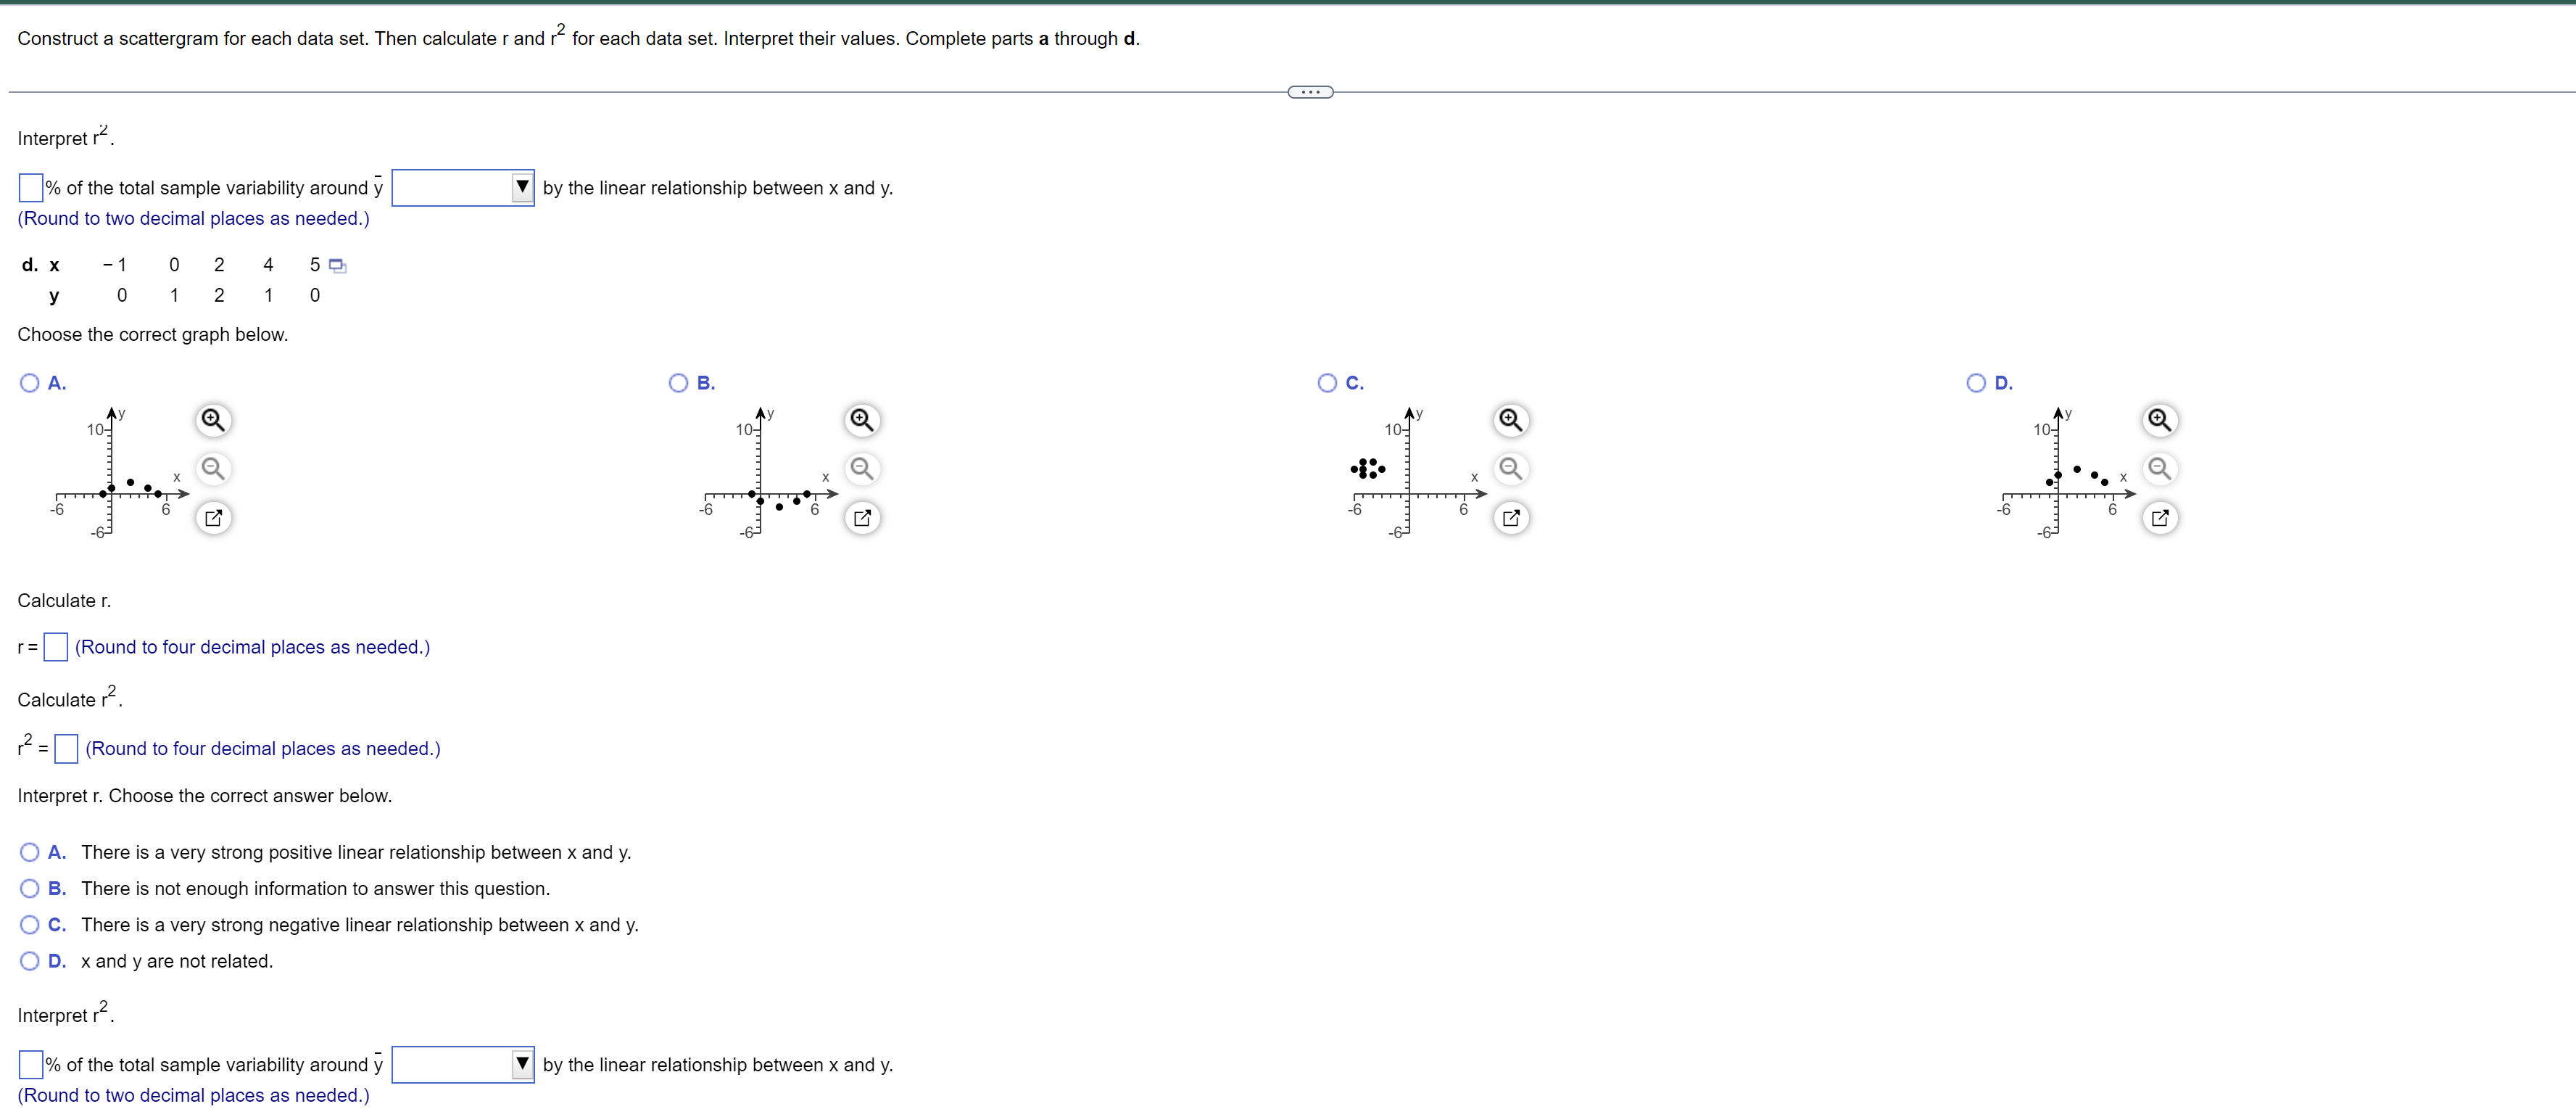
Construct a scattergram tor each data set. Then calculate r and r2 tor each data set. interpret their values. Complete parts a through d. a. x - 5 4 a - 2 1 El y - 5 2 >1 2 5 Choose the correct graph below. i3 A. Calculate r. l= (Round to four decimal places as needed.) 2 Calculate r , r = (Round to four decimal places as needed.) Interpret r. Choose the correct answer below. Ci A. x and y are not related CJ 5. There is a very strong positive linear relationship between x and y. . There is not enough information to answer this question. . There is a very strong negative linear relationship between x and y, Interpret r2. % of the total sample variability around 9 V by the linear relationship between x and y. (Round to two decimal places as needed.) b.x -5 4 -3 -2 4: y 5 2 o 1-3 Choose the correct graph below. Construct a soattergram lor each data set. Then calculate r and r2 tor each data set. interpret their values. Complete pans a through d. y 5 2 0-13 Calculate r. r= (Round [0 four declmal places as needed.) Calculate r2. r2 = 1 (Round to four decimal places as needed.) lnterpret r. Choose the correct answer below, O A. There is a very strong positive linear relationship between x and y. t: 3. There is a very strong negative linear relationship between x and y. (:l c. There is not enough inlorrnation to answer this quesllon. (:l u. x and y are not related. Interpret r2. % otthe total sample variability around 9 v by the linear relationship between x and y. (Round to two decimal places as needed.) \fConstruct a scattergrern for each data set, Then calculate r and r2 for each data set, Interpret their values. Complete parts a through d. Interpret r2. % ofthe total sample varlabillty around V by the linear relatlonship between x and y. (Round to two decimal places as needed.) d.X-10245E| y01210 Choose the correct graph below. Calculate r. r: (Round to tour declrnal places as needed.) Calculate r2. r2 = (Round lo lour decimal places as needed) Interpret r. Choose the correct answer below. , There is e very strong posltive linear relatlonship between x and y. Cl 5. There is hot enough ihrormat'lon to answer this question. Cl C, There is a very strong negative linear relationshlp between x and y. D D. x and y are not related. Interpret r2. % orthe total sample varlaoillty around )7 V by the linear relatlonship between x and y. (Round to two decimal places as needed.)
Step by Step Solution
There are 3 Steps involved in it

Get step-by-step solutions from verified subject matter experts