

Question: Examine the following sample data. a. Construct a stem-and-leaf plot to assess whether the data are from an approximately normal distribution. b. Find the values
Examine the following sample data.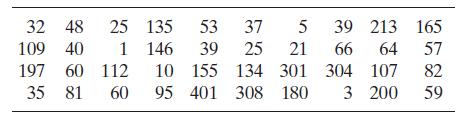
a. Construct a stem-and-leaf plot to assess whether the data are from an approximately normal distribution.
b. Find the values of QL, QU, and s for the sample data.
c. Use the results from part b to assess the normality of the data.
d. Generate a normal probability plot for the data, and use it to assess whether the data are approximately normal.
32 48 25 135 53 37 5 39 213 165 109 40 1 146 39 25 21 66 64 57 197 60 112 10 155 35 81 60 95 401 134 301 304 107 82 308 180 200 59 3
Step by Step Solution
★★★★★
3.37 Rating (144 Votes )
There are 3 Steps involved in it
1 Expert Approved Answer
Step: 1 Unlock

Question Has Been Solved by an Expert!
Get step-by-step solutions from verified subject matter experts
Step: 2 Unlock
Step: 3 Unlock