

Question: Examine the sample data. a. Construct a stem-and-leaf plot to assess whether the data are from an approximately normal distribution. b. Find the values of

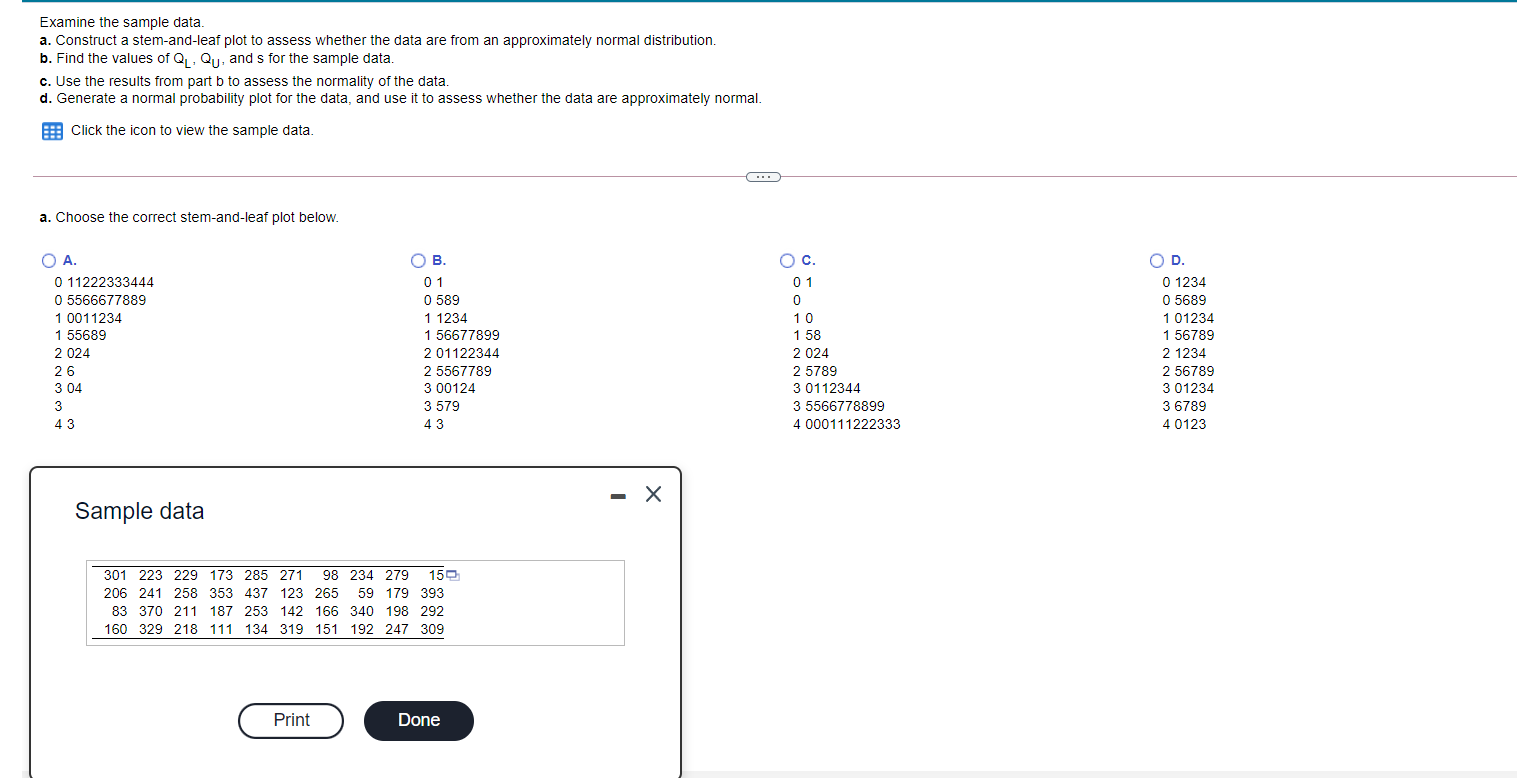
Examine the sample data. a. Construct a stem-and-leaf plot to assess whether the data are from an approximately normal distribution. b. Find the values of QL, Qu, and s for the sample data. c. Use the results from part b to assess the normality of the data. d. Generate a normal probability plot for the data, and use it to assess whether the data are approximately normal. Click the icon to view the sample data. a. Choose the correct stem-and-leaf plot below. O A. O B. O c. OD. 0 11222333444 0 1 01 0 1234 0 5566677889 0 589 0 0 5689 1 001 1234 1 1234 10 1 01234 1 55689 1 56677899 1 58 1 56789 2 024 2 01122344 2 024 2 1234 26 2 5567789 2 5789 2 56789 3 04 3 00124 3 0112344 3 01234 3 3 579 3 5566778899 3 6789 4 3 4 3 4 000111222333 4 0123 - X Sample data 301 223 229 173 285 271 98 234 279 150 206 241 258 353 437 123 265 59 179 393 83 370 211 187 253 142 166 340 198 292 329 218 111 134 319 151 192 247 309 Print Done
Step by Step Solution
There are 3 Steps involved in it

Get step-by-step solutions from verified subject matter experts