

Question: 1. fExamine the sample data. a. Construct a stem-and-leaf plot to assess whether the data are from an approximately normal distribution. b. Find the values
1.
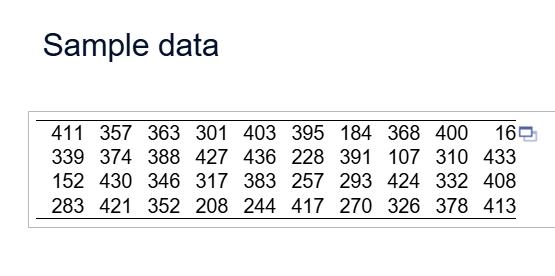
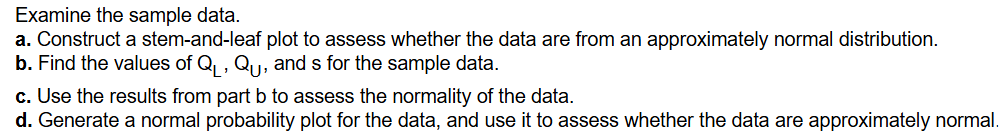
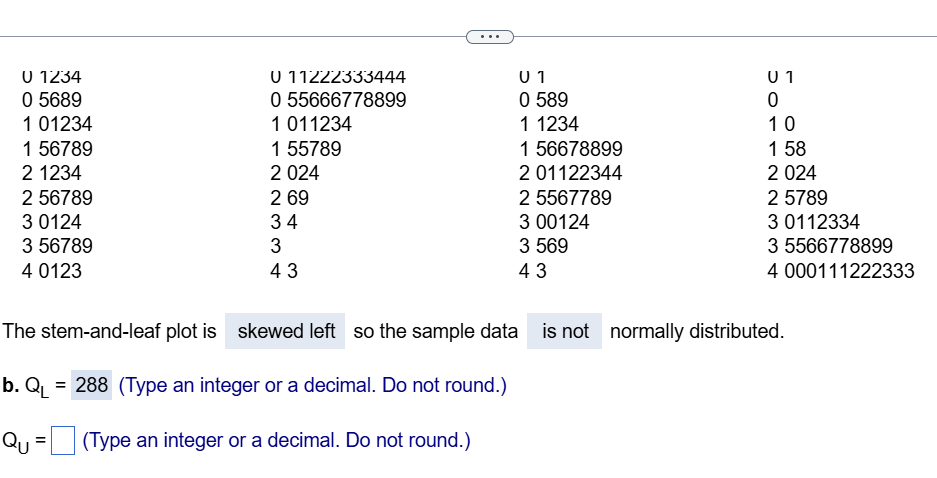
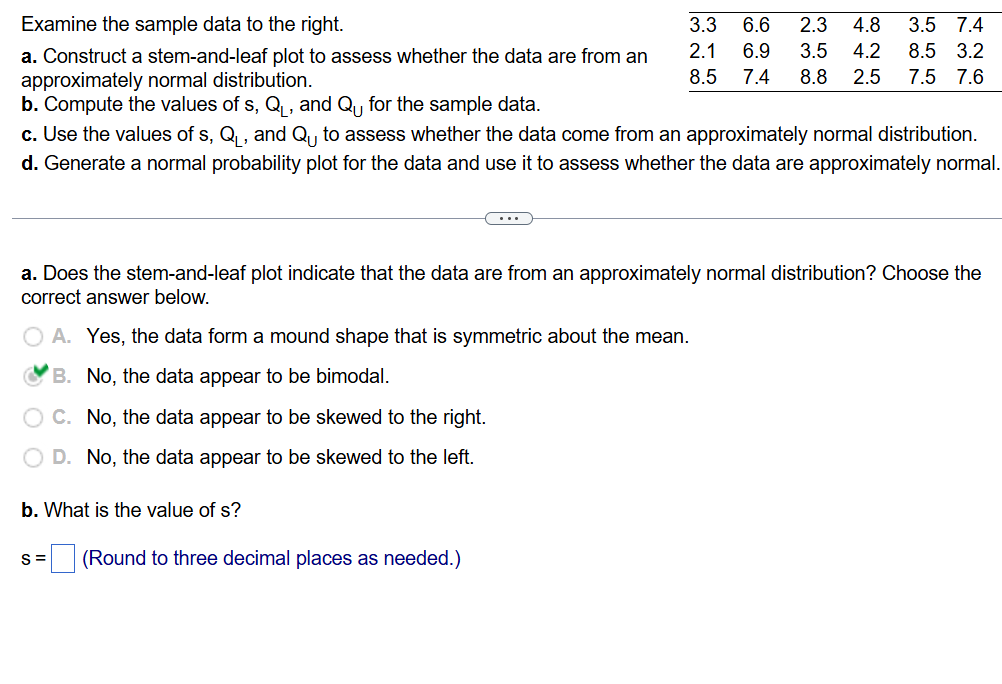
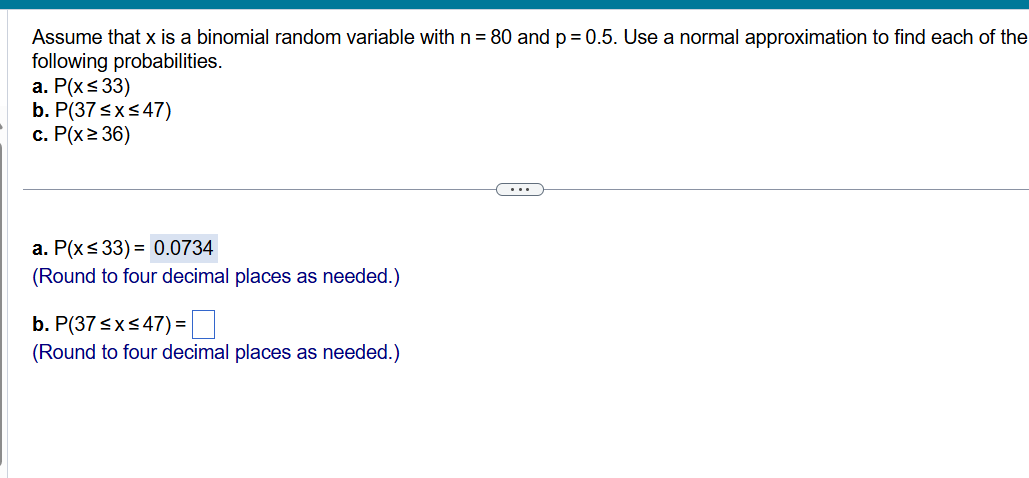
\fExamine the sample data. a. Construct a stem-and-leaf plot to assess whether the data are from an approximately normal distribution. b. Find the values of Q| , Q;, and s for the sample data. c. Use the results from part b to assess the normality of the data. d. Generate a normal probability plot for the data, and use it to assess whether the data are approximately normal. U 1234 0 5689 101234 1 56789 21234 2 56789 30124 3 56789 40123 The stem-and-leaf plotis skewed left so the sample data b. Q, = 288 (Type an integer or a decimal. Do not round.) Q= (Type an integer or a decimal. Do not round.) U 11244333444 0 55666778899 1011234 155789 2024 269 34 3 43 U1 0 589 11234 1 56678899 2 01122344 2 5567789 300124 3 569 43 U1 0 10 158 2024 25789 30112334 3 5566778899 4 000111222333 is not normally distributed. Examine the sample data to the right. 33 66 23 48 35 74 a. Construct a stem-and-leaf plot to assess whether the data are froman 2.1 69 35 42 85 3.2 approximately normal distribution. 85 74 88 25 75 76 b. Compute the values of s, Q, and Q, for the sample data. c. Use the values of s, Q , and Q,; to assess whether the data come from an approximately normal distribution. d. Generate a normal probability plot for the data and use it to assess whether the data are approximately normal. a. Does the stem-and-leaf plot indicate that the data are from an approximately normal distribution? Choose the correct answer below. Yes, the data form a mound shape that is symmetric about the mean. v No, the data appear to be bimodal. No, the data appear to be skewed to the right. No, the data appear to be skewed to the left. b. What is the value of s? s=| |(Round to three decimal places as needed.) Assume that x is a binomial random variable with n =600 and p = 0.3. Use a normal approximation to find each of the following probabilities. a. P(x> 180) b. P(170 198) \f\f\fAssume that x is a binomial random variable with n =80 and p = 0.5. Use a normal approximation to find each of the following probabilities. a. P(x
Step by Step Solution
There are 3 Steps involved in it

Get step-by-step solutions from verified subject matter experts