

Exercise 27 raised some questions about the regression model built to understand the effect of OECD regulation
Question:
Exercise 27 raised some questions about the regression model built to understand the effect of OECD regulation on GDP/ Capita in 24 OECD countries. Let’s look more deeply. Here’s a histogram of the Cook’s Distances for that model:
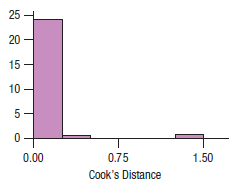
The country with high Cook’s Distance is Ireland.
a) What does the Cook’s Distance value suggest about Ireland in this model? Of the predictors available for this model, by far the best (highest R2 predictor) is 1988 GDP/Capita. In a scatterplot of GDP/Capita vs. 1988 GDP/Capita, Ireland stands away from the overall linear trend:
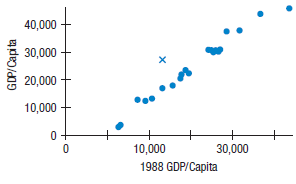
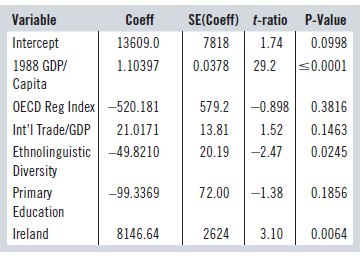
We can define a dummy variable that is “1” for Ireland and “0” for all other countries. The resulting model looks like this:
Dependent variable is: GDP/Capita
R-squared = 98.3% R-squared (adjusted) = 97.7%
s = 1713 with 24 - 7 = 17 degrees of freedom
b) Explain what the dummy variable for Ireland accomplishes in this model.
c) What ethical issue arises if we were to publish this model and use it to support a claim that OECD regulation reduces GDP per capita? (See Appendix C for Ethical Guidelines.)
Step by Step Answer:
a Ireland seems to be unlike the other OECD countries in thi...View the full answer


Business Statistics
ISBN: 9780133899122
3rd Canadian Edition
Authors: Norean D. Sharpe, Richard D. De Veaux, Paul F. Velleman, David Wright
