

The following regression is based on weekly receipts from shows on Broadway in New York City: Dependent
Question:
The following regression is based on weekly receipts from shows on Broadway in New York City:
Dependent variable is: Receipts($M)
R-squared = 93.3% R-squared (adjusted) = 93.1%
s = 0.9589 with 92 = 88 degrees of freedom
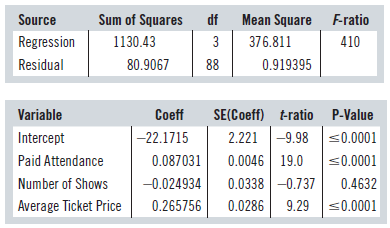
Here are some diagnostic plots:
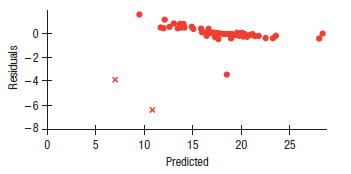
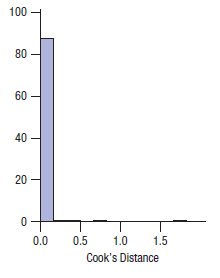
a) The two points plotted with “x” in the residuals vs. predicted plot are the two with the highest Cook’s Distances. What does this information say about how those points might be affecting the analysis? In fact, those points are reports published the last week of November and the first week of December in 2007—a time when the Stagehands Union Local One was on strike, closing down most Broadway shows. It seems that these are not representative weeks for business on Broadway. Removing them results in the following regression:
Dependent variable is: Receipts($M)
R-squared = 98.5% R-squared (adjusted) = 98.5%
s = 0.3755 with 90 - 4 = 86 degrees of freedom
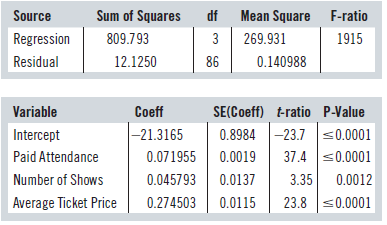
b) What changes in these estimated models support the conclusion that those two weeks were inf luential points?
c) What ethical issue would be involved in estimating receipts using the first model, i.e., the one including all the data points? (See Appendix C for Ethical Guidelines.)
Step by Step Answer:
a The points may be influential The points have both unusually low pr...View the full answer


Business Statistics
ISBN: 9780133899122
3rd Canadian Edition
Authors: Norean D. Sharpe, Richard D. De Veaux, Paul F. Velleman, David Wright
