

Here are boxplots of weekly gas prices at a service station in Alberta (in $/L): a) Compare
Question:
Here are boxplots of weekly gas prices at a service station in Alberta (in $/L):
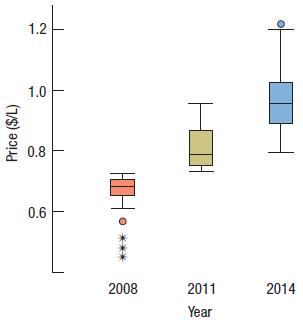
a) Compare the distribution of prices over the three years.
b) In which year were the prices least stable (most volatile)? Explain.
DistributionThe word "distribution" has several meanings in the financial world, most of them pertaining to the payment of assets from a fund, account, or individual security to an investor or beneficiary. Retirement account distributions are among the most...
Fantastic news! We've Found the answer you've been seeking!
Step by Step Answer:
a Gas prices during 2008 appeared skewed left with at least four outliers o...View the full answer

Answered By
Allan Simiyu
I am an adroit Writer. I am a dedicated writer having worked as a writer for 3 years now. With this, I am sure to ace in the field by helping students break down abstract concepts into simpler ideas.
8+ Reviews
54+ Question Solved
Related Book For 

Business Statistics
ISBN: 9780133899122
3rd Canadian Edition
Authors: Norean D. Sharpe, Richard D. De Veaux, Paul F. Velleman, David Wright
Question Posted:
