

Question: Using the data in Practice Problem 11 on shell volume and the number of sperm stored, we carried out a bootstrap analysis of the correlationcoefficient
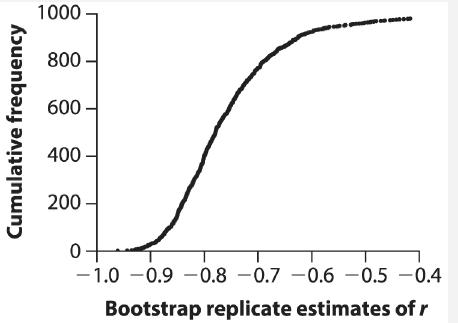
Using the data in Practice Problem 11 on shell volume and the number of sperm stored, we carried out a bootstrap analysis of the correlation coefficient r between the two variables. The cumulative frequency distribution provided here summarizes the 1000 bootstrap replicates of the estimate of the correlation coefficient. The correlation coefficient calculated from the original data was −0.78. From this graph, determine the approximate 95% bootstrap confidence interval for the correlation between shell volume and the number of sperm stored.
Data from Practice Problem 11
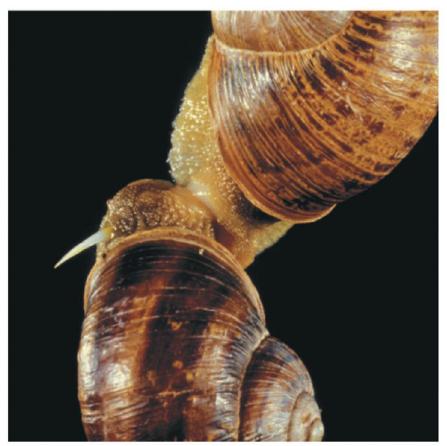
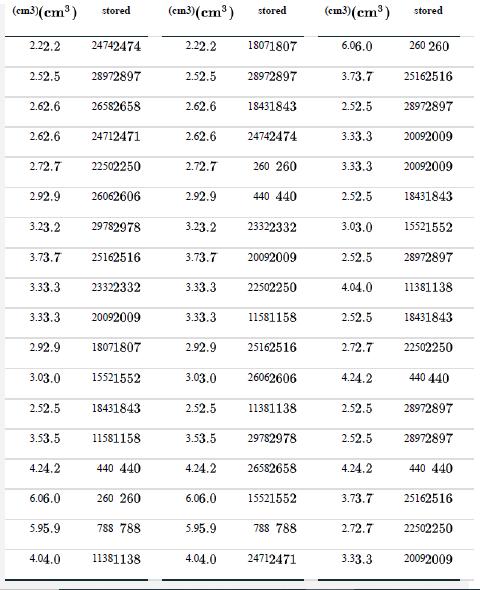
The snail Helix aspersa has an unusual mating system. Each individual is a hermaphrodite, producing both sperm and eggs, but the truly bizarre part is that these snails have evolved a “love dart” with which they try to stab their mate. (If you look closely at the photo of the snails, you can see the love dart protruding through the head of the lower snail.) This love dart is coated with a drug that enhances the amount of sperm that the stabbed snail receives and stores. This storage effect is expected to be greater when the recipient is smaller, because the relative dose would therefore be larger. Rogers and Chase (2001) measured the size of stabbed snails (i.e., the volume of their shells) and the number of stabber sperm that were stored. Is the size of the recipient snail correlated with the amount of sperm it stores? The data are listed in the table provided. The table also gives two computer-generated data sets. One of the computer-generated data sets was created by a bootstrap procedure that resampled the observed data, and the other was made by a permutation procedure (see Chapter 13).
Cumulative frequency 1000 800 600 400- 200- 0- -1.0 -0.9 -0.8 -0.7 -0.6 -0.5 -0.4 Bootstrap replicate estimates of r
Step by Step Solution
3.34 Rating (148 Votes )
There are 3 Steps involved in it
python Using the bootstrap cumulative frequency graph we can estimate the 95 confid... View full answer

Get step-by-step solutions from verified subject matter experts