

Here is a histogram of the monthly CPI as reported by the Bureau of Labor Statistics (www.bls.gov/cpi)
Question:
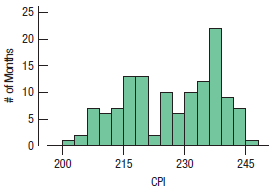
Here is a histogram of the monthly CPI as reported by the Bureau of Labor Statistics (www.bls.gov/cpi) from January 2007 through August 2017.
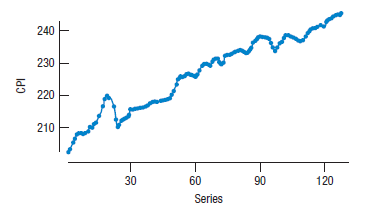
Here is the time series plot for the same data.
a) What features of the data can you see in the histogram that aren?t clear from the time series plot?
b) What features of the data can you see in the time series plot that aren?t clear in the histogram?
c) Which graphical display seems the more appropriate for these data? Explain.
d) Write a brief description of monthly CPI over this time period.
Fantastic news! We've Found the answer you've been seeking!
Step by Step Answer:
a The distribution of CPI is bimodal with one mode below 220 and the other at about 240 b ...View the full answer

Answered By
Joseph Mwaura
I have been teaching college students in various subjects for 9 years now. Besides, I have been tutoring online with several tutoring companies from 2010 to date. The 9 years of experience as a tutor has enabled me to develop multiple tutoring skills and see thousands of students excel in their education and in life after school which gives me much pleasure. I have assisted students in essay writing and in doing academic research and this has helped me be well versed with the various writing styles such as APA, MLA, Chicago/ Turabian, Harvard. I am always ready to handle work at any hour and in any way as students specify. In my tutoring journey, excellence has always been my guiding standard.
1+ Reviews
10+ Question Solved
Related Book For 

Business Statistics
ISBN: 9780134705217
4th Edition
Authors: Norean Sharpe, Richard Veaux, Paul Velleman
Question Posted:
