

Question: In Applied Multivariate Techniques (John Wiley and Sons, 1996), Subhash Sharma considers a study in which 143 respondents rated three brands of laundry detergents on
V1: Gentle to natural fabrics
V2: Won€™t harm colors
V3: Won€™t harm synthetics
V4: Safe for lingerie
V5: Strong, powerful
V6: Gets dirt out
V7: Makes colors bright
V8: Removes grease stains
V9: Good for greasy oil
V10: Pleasant fragrance
V11: Removes collar soil
V12: Removes stubborn stains
Table 3.13 is a matrix containing the pairwise correlations between the variables, and Figure 3.36 is the SPSS output of a factor analysis of the detergent data. (1) Examining the €œEIGENVALUE€ column in Figure 3.36, and recalling that the eigenvalue of a factor is the variance of the factor, explain why the analyst chose to retain two factors. (2) Discuss why factor 1 can be interpreted to be the ability of the detergent to clean clothes. (3) Discuss why Factor 2 can be interpreted to be the mildness of the detergent.
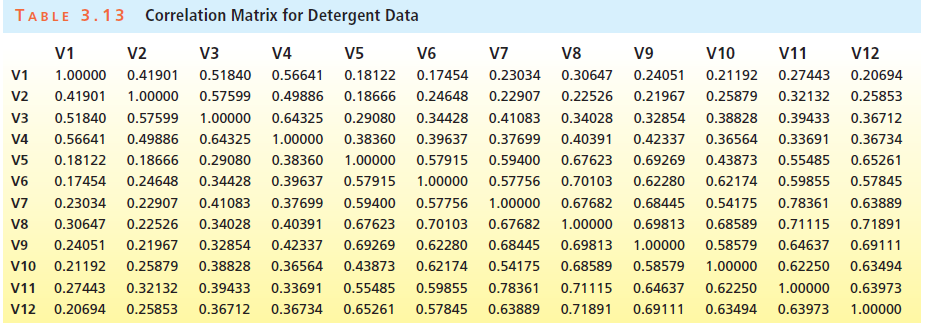
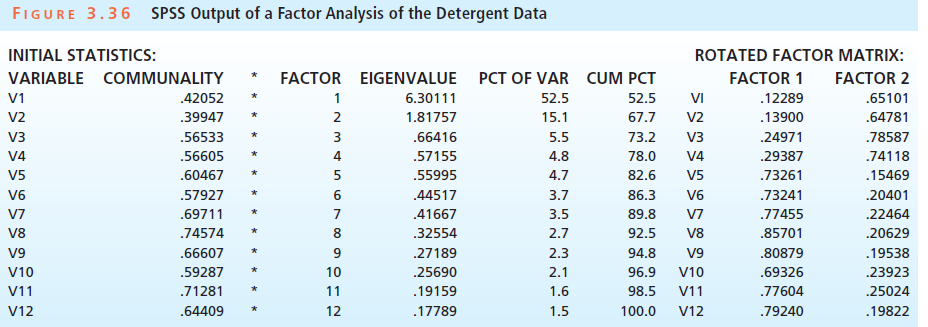
TABLE 3.13 Correlation Matrix for Detergent Data V10 V4 V2 1.00000 0.41901 0.51840 0.56641 1.00000 0.57599 0.57599 0.49886 0.18666 V3 V8 0.23034 0.30647 0.24051 0.22526 0.34028 0.40391 0.67623 0.70103 0.67682 1.00000 V9 V11 0.27443 0.32132 0.39433 V1 V5 0.18122 0.17454 V6 V7 V12 0.20694 0.25853 V1 0.21192 0.25879 0.38828 0.36564 0.43873 0.62174 0.49886 0.18666 0.22907 0.41083 0.37699 0.21967 0.32854 0.42337 0.69269 0.62280 0.68445 0.41901 V2 0.24648 0.34428 0.39637 0.51840 1.00000 0.64325 V3 0.56641 0.18122 0.64325 1.00000 0.38360 0.39637 0.37699 0.29080 0.38360 1.00000 0.36712 0.36734 0.65261 0.57845 V4 0.33691 0.55485 V5 V6 0.29080 0.34428 0.41083 0.34028 0.32854 0.38828 0.57915 1.00000 0.57756 0.59400 0.57756 1.00000 0.67682 0.68445 0.54175 0.59855 0.17454 0.23034 0.30647 0.24648 0.22907 0.22526 0.21967 0.25879 0.57915 V7 0.54175 0.68589 0.58579 1.00000 0.63889 0.78361 0.59400 0.67623 V8 0.70103 0.40391 0.42337 0.69813 1.00000 0.58579 0.71115 0.71891 V9 V10 0.21192 0.27443 0.20694 0.64637 0.69269 0.43873 0.55485 0.65261 0.24051 0.62280 0.62174 0.59855 0.57845 0.69813 0.69111 0.68589 0.36564 0.62250 1.00000 0.63973 0.63494 0.63973 1.00000 0.32132 0.25853 0.39433 0.78361 0.64637 0.62250 V11 V12 0.33691 0.36734 0.71115 0.71891 0.63889 0.63494 0.36712 0.69111 FIGURE 3.36 SPSS Output of a Factor Analysis of the Detergent Data INITIAL STATISTICS: VARIABLE COMMUNALITY .42052 .39947 .56533 .56605 .60467 .57927 .69711 .74574 .66607 .59287 ROTATED FACTOR MATRIX: FACTOR 2 .65101 .64781 .78587 .74118 .15469 .20401 .22464 .20629 .19538 .23923 .25024 .19822 FACTOR EIGENVALUE PCT OF VAR CUM PCT 52.5 FACTOR 1 .12289 V1 V2 VI 52.5 6.30111 1.81757 .66416 .57155 .55995 .44517 .41667 .32554 .27189 .25690 .19159 .17789 67.7 73.2 15.1 5.5 4.8 4.7 3.7 3.5 2.7 2.3 .13900 .24971 .29387 .73261 .73241 .77455 .85701 .80879 .69326 .77604 2 3 4 5 V2 V3 V3 V4 78.0 82.6 86.3 V4 V5 V5 6. V6 V6 V7 V8 89.8 92.5 94.8 96.9 98.5 100.0 V7 8 V8 V9 V10 V9 10 V10 2.1 1.6 V11 .71281 .64409 11 12 1.5 V11 V12 V12 .79240
Step by Step Solution
3.41 Rating (179 Votes )
There are 3 Steps involved in it
Only the first two factors have eigenvalues or variances above 1 the ... View full answer

Get step-by-step solutions from verified subject matter experts