

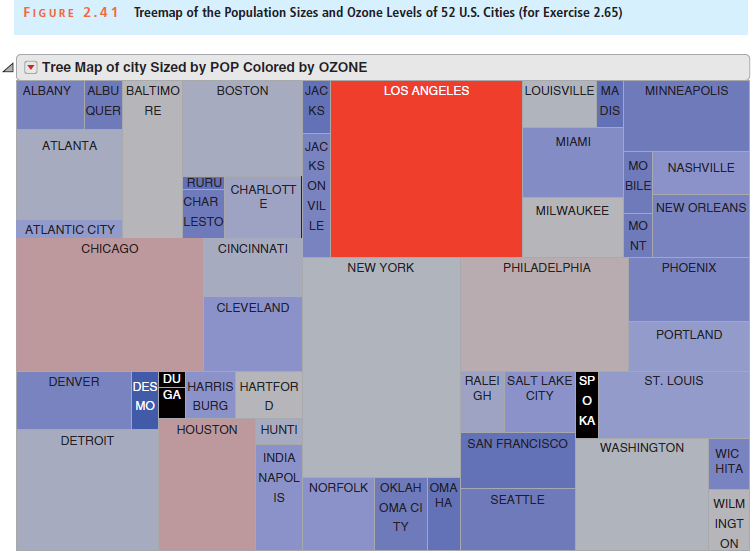
In the treemap in Figure 2.41, dark blue represents the lowest ozone level and bright red represents
Question:
Fantastic news! We've Found the answer you've been seeking!
Step by Step Answer:
The ozone level is ...View the full answer

Answered By
Gaurav Soni
Teaching was always an area where I can pursue my passion. I used to teach my friends and junior during my school and college life. After completing my professional qualification (chartered accountancy) and before joining my job, I also joined an organization for teaching and guidance to my juniors. I had also written some articles during my internship which later got published. apart from that, I have also given some presentations on certain amendments/complex issues in various forms.
Linkedin profile link:
https://www.linkedin.com/in/gaurav-soni-38067110a
7+ Reviews
13+ Question Solved
Related Book For 
Business Statistics In Practice Using Data Modeling And Analytics
ISBN: 9781259549465
8th Edition
Authors: Bruce L Bowerman, Richard T O'Connell, Emilly S. Murphree
Question Posted:
