

Question: Read the approximate predicted waiting times for Soarin and Test Track at 8 p.m. off of the time series plots in Figure 1.9. Construct a
Read the approximate predicted waiting times for Soarin€™ and Test Track at 8 p.m. off of the time series plots in Figure 1.9. Construct a hand-drawn bullet graph of these two predicted waiting times.
Figure 1.9
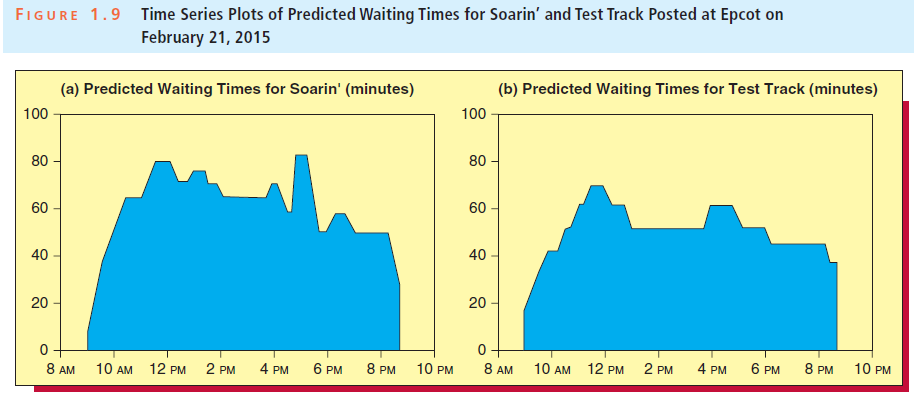
Time Series Plots of Predicted Waiting Times for Soarin' and Test Track Posted at Epcot on February 21, 2015 FIGURE 1.9 (b) Predicted Waiting Times for Test Track (minutes) (a) Predicted Waiting Times for Soarin' (minutes) 100 100 80 80 60 60 40 - 40 20 20 10 PM 8 PM 6 PM 4 PM 2 PM 12 PM 10 AM 8 AM 10 PM 8 PM 6 PM 4 PM 2 PM 12 PM 10 AM 8 AM
Step by Step Solution
3.31 Rating (160 Votes )
There are 3 Steps involved in it
Test Tra... View full answer

Get step-by-step solutions from verified subject matter experts